What Are Alhena Experiments?
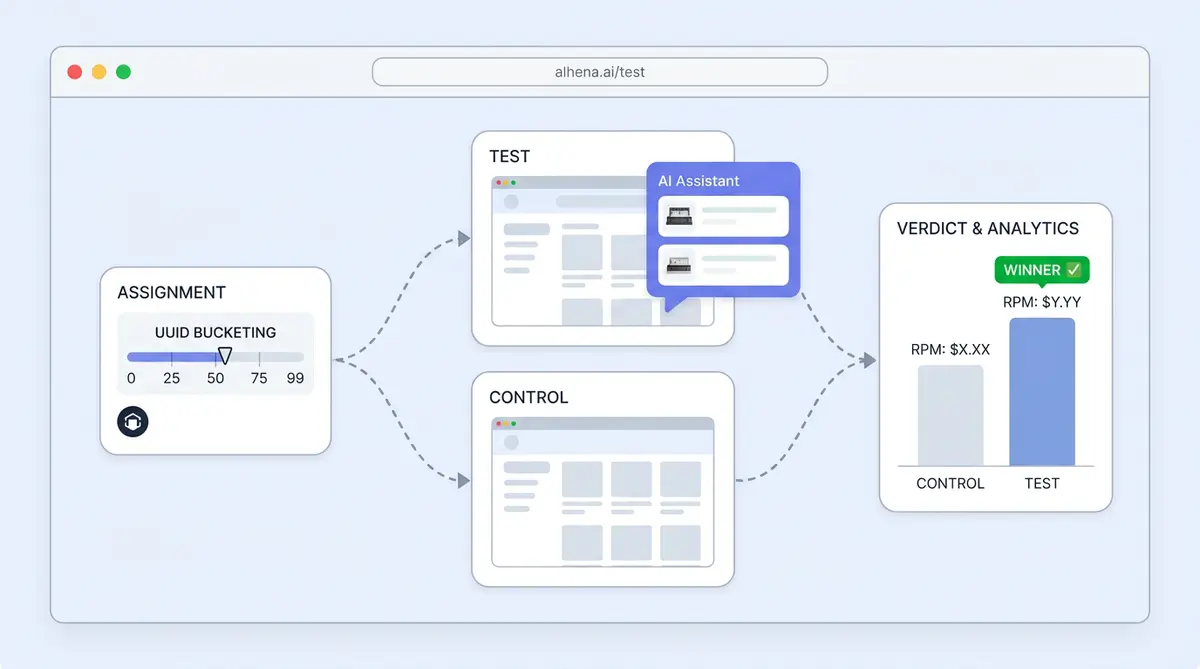
Alhena Experiments is a native A/B testing feature built into the Alhena AI platform. It splits your website visitors into test and control groups, shows one group the AI shopping assistant and hides it from the other, then measures which group generates more revenue. No external tools required.
The core question it answers: Does your AI chatbot actually increase conversions and revenue, or are you just assuming it does?
According to DRIP's 2026 A/B testing benchmarks, only 20 to 30 per cent of e-commerce A/B tests produce a statistically significant winner. That means most brands running chatbot experiments with generic tools are burning time on inconclusive results. Alhena Experiments keeps audience assignment, revenue tracking, and statistical analysis in one place.
Why Do You Need Built-In A/B Testing for Your AI Chatbot?
Most e-commerce teams measure chatbot performance with vanity metrics. They look at chat volume, maybe CSAT scores, and call it a day. None of those prove your AI drives revenue.
A 2026 study by Master of Code found that 80 percent of e-commerce businesses now use chatbots, but fewer than 15 percent can tie chatbot interactions to completed orders. That gap exists because most chatbot platforms don't track revenue natively, and plugging in an external A/B testing tool like Optimizely or VWO adds complexity most CX teams can't handle alone.
Alhena Experiments closes that gap. Here's what it replaces:
- No separate A/B testing platform needed. Audience splitting, tracking, and reporting all live inside Alhena's analytics dashboard.
- No developer setup for each experiment. You configure the test in the dashboard, choose your split, and start it. You'll see results in the same reports you already check daily.
- No manual revenue stitching. Alhena's cart and checkout tracking connects each purchase to the correct experiment group automatically.
For a deeper look at measuring AI-driven revenue, see our guide to holdout tests and incremental revenue measurement.
How Does Alhena Experiments Work?
Four layers work together: the analytics dashboard, the website SDK, experiment events, and revenue tracking. Here's the step-by-step flow.
How Do You Create an Experiment?
Go to Analytics > Experiments inside your Alhena dashboard. Give your experiment a name and choose the audience split. Most brands start with a 50/50 split between test and control.
Before the experiment can start, Alhena checks that your cart and checkout event tracking is already installed and working. If it's not, the dashboard tells you what's missing. No tracking, no experiment. That guard rail is there for a reason. You'll discover any tracking gaps before they waste your testing window.
How Does Visitor Assignment Work?
When a shopper lands on your site, the Alhena website SDK checks whether an active experiment exists. If one does, the SDK assigns the visitor to test or control before anything renders on screen. There's no visible flash of the wrong experience.
Assignment is deterministic, not random. Alhena takes the shopper's persistent fingerprint and converts it into a numeric bucket that maps to your configured split. For a 50/50 experiment:
- Half the buckets = test group (sees Alhena AI)
- The other half = control group (does not see Alhena AI)
The same shopper always lands in the same group, even across multiple sessions. No more crossover contamination from session-based randomization. For e-commerce testing, clean assignment is everything.
What Is the experiment:loaded Event?
Once assignment happens, the SDK fires an experiment:loaded event with either test or control as the value. Your team can use this event to:
- Load an alternate support tool (like a legacy chatbot) for the control group
- Send the experiment group to Google Analytics 4 or Segment for cross-platform analysis
- Trigger custom page behavior like product recommendations based on group assignment
How Does Revenue Tracking Connect to Experiments?
Every cart addition and checkout event gets linked back to the same user fingerprint and experiment group. Alhena's revenue attribution engine handles this automatically, so you don't need to build custom data pipelines or configure third-party analytics.
What Can You Test with Alhena Experiments?
Three experiment types are available right now:
- Widget visibility. The test group sees the Alhena AI chat widget. The control group doesn't. Most brands run this first because it answers the fundamental question: does showing AI to shoppers increase conversions and revenue?
- Nudge visibility. The test group sees proactive AI nudges (product recommendations, exit-intent messages, free shipping reminders). The control group gets the standard chat widget without nudges. That isolates whether proactive messages actually move the needle on revenue.
- FAQ answering mode. Compares different product FAQ answer experiences, like inline answers on the product page versus answers delivered through the chat widget. You'll see which format drives more add-to-cart actions.
The main dashboard flow focuses on "Alhena AI versus no Alhena AI" revenue experiments. This is the test most e-commerce brands run first because it directly proves ROI to leadership.
If you want to go beyond these three test types, our e-commerce AI A/B testing guide covers seven high-impact chatbot tests for conversion rate optimization.
What Metrics Does Alhena Experiments Track?
Both groups get compared across 11 revenue and engagement metrics:
- Total exposed users per group
- Conversion rate (purchases divided by exposed users)
- Total cart value across all add-to-cart events
- Users who added to cart
- Average cart value
- Total revenue from completed purchases
- Total purchases
- Average checkout value
- Average items per purchase
- Revenue per user (RPU), the primary metric for statistical testing
- Delta between test and control, the difference that tells you if AI is winning
Revenue per user is the metric Alhena uses for significance calculations. It's a better signal than conversion rate alone because it accounts for order value differences between groups. A test group might convert at the same rate as the control but generate 20 per cent higher order values. RPU catches that.
You can monitor all of these in real time from the Alhena analytics dashboard.
How Does Alhena Determine a Winner?
You can't declare a winner based on gut feeling. The system enforces two hard requirements before marking a result:
- Minimum checkout volume across both groups combined. Alhena won't declare a result until enough shoppers in both groups have completed purchases.
- Statistical significance. Alhena runs a statistical test on revenue per user and only flags a result when the confidence level is high enough to rule out random chance.
Once those thresholds are met, the experiment gets one of three outcomes:
- WON: The test group (with Alhena AI) outperformed the control group with statistical significance. Your AI is driving real revenue.
- LOST: The control group outperformed the test group. Rare, but useful. It points to what needs fixing before you go wider.
- INCONCLUSIVE: Not enough data or no statistically reliable difference between groups. You either need more traffic or a longer test window.
Experiments default to a 30-day run. They can also end automatically when the configured end date passes. Only one experiment can run at a time per bot profile, which prevents overlapping tests from contaminating each other's data.
Brands like Tatcha have seen 3x conversion rates and a 38 per cent AOV uplift with Alhena AI. Puffy hit 63 per cent automated inquiry resolution with 90 per cent CSAT. These numbers come from real experiment data, not guesswork.
How Is This Different from Using Optimizely or Google Optimize?
You could technically A/B test your AI chatbot with a standalone experimentation platform. But here's why built-in testing inside Alhena is better for e-commerce teams:
- Single-system attribution. External tools need you to stitch experiment data to revenue data across platforms. Alhena does this natively because it already tracks carts and checkouts.
- Fingerprint-based persistence. Most external tools rely on cookies or session IDs, which break when shoppers switch devices or clear cookies. Alhena's fingerprint UUID persists across sessions, giving you cleaner group assignment.
- No engineering overhead. Setting up Optimizely or LaunchDarkly for chatbot experiments requires developer time for SDK integration, event forwarding, and data pipeline configuration. Alhena Experiments needs zero additional code if you already have the widget installed.
- Revenue-first metrics. External A/B tools track clicks, pageviews, and conversions generically. Alhena tracks e-commerce-specific metrics like average cart value, checkout value, and revenue per user out of the box.
That said, if you're already running a mature experimentation program with LaunchDarkly or VWO for product features beyond AI, you can still use the experiment:loaded event to feed Alhena experiment data into those platforms. The Alhena SDK reference documents exactly how.
What Do You Need Before Running Your First Experiment?
Before you click "Start Experiment", make sure these prerequisites are in place.
Pre-Experiment Checklist
- Cart tracking installed. Your store needs to fire add-to-cart events with product IDs and values. The dashboard will block experiment creation if this isn't working.
- Checkout tracking installed. Same requirement for completed purchases. Both cart and checkout events must fire reliably before you start.
- Enough traffic. You need enough checkout volume across both groups to reach significance. The exact threshold depends on your traffic and order patterns. Low-volume stores may need to run experiments longer than 30 days. Don’t stop early just because the numbers look good.
- A plan for the control group. Control users won't see the Alhena AI widget. If your brand still wants support coverage for those visitors, set up an alternate support tool using the
experiment:loadedevent callback. - One experiment at a time. Only one experiment can run per bot profile. Finish or stop the current experiment before starting a new one.
Need help with the initial setup? Alhena deploys in under 48 hours, and the team can walk you through experiment configuration during onboarding. Book a demo to get started.
When Should You Run an Alhena Experiment?
Not every moment is the right time to test. Here are the scenarios where experiments deliver the most value:
- Right after deploying Alhena AI. Run a 30-day "AI on vs. AI off" experiment during your first month to establish a revenue baseline. This gives you hard data for your next budget review.
- Before rolling out a new AI behavior. Testing nudge visibility or a new FAQ format on 50 percent of traffic reduces rollout risk. If the new behavior hurts conversions, you’ll catch it before it affects everyone.
- During seasonal traffic spikes. Higher traffic means faster statistical significance. Black Friday or back-to-school periods can cut your experiment duration in half. Our Shopify AI chatbot ROI guide explains how to time experiments for maximum impact.
- When leadership asks, "What's the ROI?" An experiment with WON status and a clear revenue-per-user delta is the strongest evidence you can present. It's causal proof, not a correlation chart. Don't wait for the next planning cycle to start.
What Happens After the Experiment Ends?
Once an experiment hits its end date or you manually stop it, Alhena locks the results. You'll see a clear verdict: WON, LOST, or INCONCLUSIVE.
If the result is WON, you have the data to justify keeping Alhena AI on for 100 per cent of your traffic. Share the revenue-per-user delta with your CFO. That single number tells the story better than any slide deck.
If the result is LOST or INCONCLUSIVE, don't panic. This usually points to a configuration issue, not a platform problem. Common causes include:
- Greeting messages that don't match shopper intent
- Product catalog gaps in the AI's knowledge base
- Nudge timing that interrupts rather than assists, or offers and discount messaging that feels pushy
Review your CRO chat platform checklist to identify what to tune, then run a follow-up experiment after making changes.
Key Takeaways
- Alhena Experiments is a built-in e-commerce A/B testing feature that splits visitors into test and control groups and measures revenue impact directly.
- No external tools required. Audience assignment, event tracking, revenue attribution, and statistical significance all happen inside Alhena.
- Deterministic fingerprint-based assignment keeps shoppers in the same group across sessions, eliminating cookie-based contamination.
- Three e-commerce experiment types: widget visibility, nudge visibility, and FAQ answering mode.
- Results require real evidence: sufficient checkout volume and statistical significance before Alhena declares a winner.
- Revenue per user is the primary metric, not just conversion rate, because it captures order value differences between groups.
- One experiment per bot profile at a time to prevent data contamination.
- Cart and checkout tracking must be installed first. The dashboard blocks experiment creation until tracking is verified.
Ready to prove your AI chatbot drives revenue, not just conversations? Book a demo with Alhena AI or start for free with 25 conversations.
Frequently Asked Questions
What is Alhena Experiments?
Alhena Experiments is a native split testing feature built into the Alhena AI platform for ecommerce brands. It runs a controlled experiment by splitting your site visitors into two groups, showing one group the AI shopping assistant and hiding it from the other, then comparing conversion data between them. You get a clear test result without needing a separate test tool.
How does Alhena assign visitors to test or control groups?
Each visitor gets a persistent fingerprint that maps to a numeric bucket. That bucket determines which variant they see for the entire experiment. The assignment is deterministic, so the same shopper always stays in the same group regardless of how many times they return. This consistent behavior prevents the crossover contamination that breaks split test results on other platforms.
What metrics does Alhena Experiments track?
The analytics dashboard tracks 11 metrics: conversion rate, total revenue, average cart value, checkout value, revenue per user, total purchases, average items per purchase, and the delta between groups. You can analyze all of this data in real time. Revenue per user is the primary metric for statistical significance because it captures both conversion and order value differences.
How much traffic do I need for a valid experiment?
You need enough checkout volume in both groups for the test result to be statistically meaningful. The exact sample size depends on your traffic patterns and how large the conversion difference is between groups. Higher-traffic ecommerce sites reach significance faster. Low-volume stores should plan for longer experiment windows rather than cutting a test short.
What experiment types does Alhena support?
Three types. Widget visibility tests whether showing the AI to shoppers changes their buying behavior. Nudge visibility tests whether proactive messages improve the customer experience enough to lift conversion. FAQ answering mode compares different ways of presenting product answers. Each one starts with a hypothesis about what drives shoppers to buy, and the experiment either confirms or rejects it.
Can I run multiple experiments at the same time?
No. Only one experiment can run per bot profile at a time. Running overlapping tests would contaminate the data and make it impossible to analyze which change caused the result. Finish one, review the test result, then run the next. A disciplined test strategy matters more than running tests fast.
How is Alhena different from Optimizely or other A/B test tools?
Most test tools are built for page-level experimentation, things like button colors or subject line changes on email campaigns. Alhena is built to test AI on an ecommerce site. It tracks cart and checkout events natively, so you don't need to stitch revenue data from multiple sources. Compare that to Optimizely, where testing a chatbot's revenue impact requires custom event forwarding and a separate analytics pipeline.
What do WON, LOST, and INCONCLUSIVE results mean?
WON means visitors who interacted with Alhena AI had a higher conversion rate and revenue per user than the control group, with statistical significance. LOST means the control group did better, which usually points to a configuration issue you can fix. INCONCLUSIVE means the data wasn't enough to call it either way. In that case, you either need more traffic or a longer test window before you can analyze the result with confidence.
Do I need developer help to set up an experiment?
Not if you already have the Alhena widget and checkout tracking on your ecommerce site. You create and run tests directly from the dashboard. The system handles the split, tracks every conversion, and automates the statistical analysis. The only developer work is the initial widget installation, which Alhena's team typically completes during onboarding.
What is the difference between A/B testing and multivariate testing?
A standard A/B test, also called a split test, compares two variants: AI on versus AI off, for example. A multivariate test compares multiple variables at once, like testing different greeting messages, product image layouts, and nudge timing in the same experiment. Alhena Experiments focuses on A/B splits because they give you a cleaner test result with less traffic. If you want to optimize multiple elements, run sequential A/B tests rather than one complex multivariate test.
How does A/B testing compare to multi-armed bandit testing?
A/B testing splits traffic evenly and waits for a definitive test result before picking a winner. A multi arm bandit approach (also called multi-armed bandit) shifts traffic toward the better variant while the test is still running, which can optimize conversion faster but makes the final analysis less clean. Alhena uses the traditional A/B split because ecommerce brands typically need a clear, defensible result they can present to leadership, not a gradually shifting allocation.
Can Alhena Experiments help reduce cart abandonment?
Yes. Run a widget visibility experiment and compare cart abandonment rates between the test and control groups. If shoppers who interact with the AI complete checkout more often, you have direct evidence that the assistant reduces drop-off. Your hypothesis going in might be that AI reduces drop-off. Brands use this data to build the business case for keeping AI on across their entire ecommerce site. The test also reveals whether specific AI behaviors like product recommendations or shipping answers drive the biggest conversion lift.
How should I plan a test strategy for my store?
Start with your biggest business goal. If you need to prove AI ROI, run a widget visibility experiment first. If you already know AI helps and want to optimize how it helps, test nudge visibility or FAQ formats. Analyze each test result before moving to the next experiment. The best ecommerce brands treat experimentation as an ongoing part of their market strategy, not a one-time exercise. Even a single case study from your own store data is more persuasive than any vendor benchmark.