Most AI Dashboards Show You Deflection Rates. This One Shows You a P&L.
Most ecommerce analytics dashboards give you a handful of vanity metrics: total chats, average response time, maybe a thumbs-up/thumbs-down satisfaction score. You're left guessing whether your AI is actually doing anything for the business.
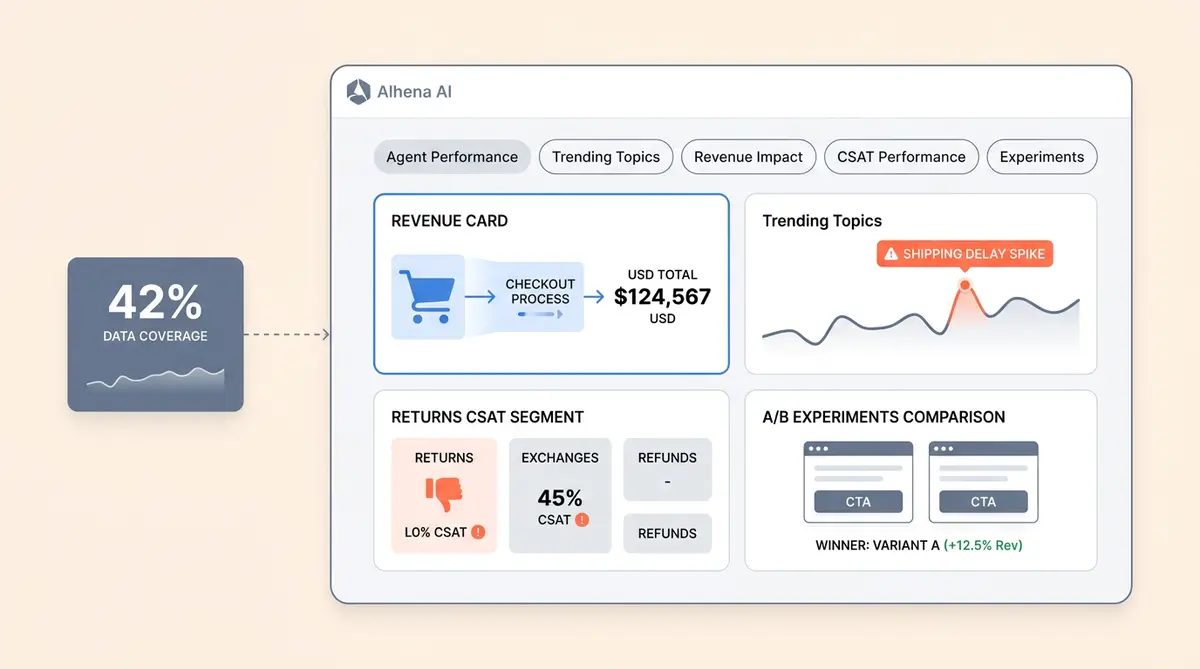
The Alhena AI analytics dashboard takes a different approach. It answers five questions that matter to anyone running an ecommerce operation: How much work is my AI doing? What are customers talking about? Is the AI driving revenue? Are customers happy with the answers? And which configuration actually wins?
This post walks through every tab, every metric, and every formula behind the numbers. You'll learn how to analyze performance metrics, understand your reporting dashboard, and make data driven decisions about your AI investment. Consider it a complete overview of the best ecommerce dashboard features for AI-powered commerce. Unlike generic dashboard examples or sales dashboard templates you'll find on Databox or GA4 blogs, this is a purpose-built analytics engine. Unlike Google Analytics or GA4, which use pre-built template views and dashboard examples focused on page-level behavior, this tracks conversations, revenue, and customer satisfaction in one place. No GA4 custom configuration needed. Standard Google Analytics dashboard examples simply can't track what happens inside a conversation. If you're evaluating an ecommerce analytics dashboard, comparing it to GA4 or Google Analytics, or trying to get more from the one you already have, this is the decoder ring.
How the Alhena Analytics Dashboard Works Under the Hood
Before decoding individual metrics, it helps to understand the plumbing. The dashboard is a tabbed interface where each tab triggers a REST call to a Django backend, which runs a parameterized query against pre-aggregated BigQuery tables. The result flows back into a React frontend that renders charts, visualization tiles, and trend indicators showing key performance metrics.
Three things make this architecture worth noting, and they matter for any ecommerce dashboard that promises operational efficiency:
- Pre-aggregated tables. Alhena doesn't query raw event logs at dashboard-load time. Data is pre-aggregated into partitioned BigQuery tables, which is why the dashboard loads in under two seconds even across millions of conversations.
- Period-over-period is always on. Every single metric fires a second query against the equivalent previous time window. That green "+12%" pill next to each number? It's not decoration. It's a real comparison against last period, calculated automatically.
- Parameterized queries everywhere. Every BigQuery call uses typed parameters instead of string concatenation. No SQL injection risk, and the queries cache efficiently.
These filters give you an overview of your entire ecommerce dashboard at any granularity. Unlike standard analytics that only show page views and basic sales numbers, the global filters here apply across every tab: AI Profile (single bot or all profiles rolled up), Source/Integration (Web, Email, Instagram DMs, WhatsApp, Slack, and 15+ integrations covering multiple marketing channels and social platforms, including WooCommerce), and Date Range (presets or custom). Pick your slice, and every number on screen updates in real-time. This ecommerce dashboard gives you the best view of performance across all channels.
Agent Performance: The Core Operational View
The Agent Performance tab is where most teams spend their time. With features that go beyond basic conversation counts, it helps you track how work is distributed between AI and humans. It's your operational scoreboard, answering the basic question: how is work being distributed between AI and humans?
Here's every metric on this tab and what it actually counts:
Total Conversations
Every conversation in the selected time window, regardless of who handled it. This is your volume baseline. If you're tracking growth or seasonal patterns, this is the number to watch.
AI Profile Conversations
Conversations handled end-to-end by the AI with no human involvement. When brands like Crocus report an 86% deflection rate, this is the metric behind that number: AI profile conversations divided by total conversations.
Human Agent Conversations
Conversations where a human agent stepped in. This isn't a failure metric. Some conversations genuinely need a person, like complex order disputes or VIP escalations. The goal is to make sure this number reflects intentional routing, not AI gaps.
Agent Assist Conversations
Human-led tickets where the AI drafted replies for the agent. The human stays in control, but the AI does the research and writing. This is the metric that tells you how much faster your human agents are working with AI backup.
Resolution Rate
The percentage of AI conversations where the customer didn't need a human afterwards. The formula: AI conversations divided by the sum of AI, human, and agent assist conversations. Puffy runs at 63% automated resolution with 90% CSAT, which shows resolution rate and satisfaction aren't a tradeoff.
CSAT Rating
The aggregate customer satisfaction score for the selected channel. Calculated as the sum of 4-5 star ratings divided by total ratings collected. This gives you a quick pulse, but the real depth lives in the dedicated CSAT tab (more on that below).
Credit Usage
Platform credits consumed during the window. This only appears for organizations on credit-based plans and only for org admins. If you're on a seat-based plan, you won't see this tile at all.
Source-Aware Metric Display
Here's a detail most ecommerce dashboards skip, and it's a gap that hurts profitability tracking: the Agent Performance tab doesn't show the same tiles for every channel. The metrics adapt based on which source you're filtering.
- Web and Nudges: Full suite, including total, AI, human, credit, resolution rate, and CSAT.
- Social channels (Instagram, Facebook, WhatsApp): AI conversation count and credits only, since humans don't typically handle those through the same flow.
- Agent Assist: Only shows the number of agent assist interactions.
- Product FAQ: Splits conversations into "started by tapping an AI FAQ" versus "started by direct message," so you can see which suggested questions actually get used.
- Playground: Credits are hidden because playground is free for experimentation.
This source-aware behavior means you never see irrelevant metrics cluttering the view. If you're looking at Instagram DM performance, users see Instagram DM metrics. Nothing else. The ecommerce dashboard adapts to what each channel needs.
Top 10 Panels
For Web, Product FAQ, Nudges, and Icebreaker channels, the tab also shows two "Top 10" side panels: the top 10 countries and the top 10 page URLs generating the most conversations. These come from grouping by referrer URL path and location, which tells you exactly where your AI is working hardest and which pages on your site generate the most conversations and which drive the most sales.
Trending Topics: What Your Customers Are Actually Talking About
Every conversation that passes through Alhena gets tagged with topics by an LLM classifier. The Trending Topics tab aggregates those tags and shows you four views:
- Volume per topic: How many conversations hit each topic in your selected window.
- Topic trends: A daily time series per topic, so you can spot spikes early. Shipping questions suddenly doubled on Tuesday? You'll see it here.
- Top URLs and countries per topic: Which pages or geographies drove that topic. If a spike correlates with a specific product page or geographic region, you can connect the dots between what's happening on your site and what customers are asking about. If "returns" is trending and it's mostly coming from your UK site, that's a very different action item than if it's global.
- Drill-down view: Click any topic and see the actual conversations tagged with it.
This is the "voice of customer" layer that most AI chatbot analytics tools either skip entirely or lock behind an expensive add-on. For ecommerce teams, it's bottom-funnel gold. A spike in "size guide" questions on your fashion store tells you the product page needs better sizing info. A spike in "coupon not working" tells you something broke in your promo setup, and it's costing you sales.
The difference between a team that reacts to problems and a team that catches a drop in satisfaction early often comes down to whether they have a view like this.
Revenue Impact: From Conversations to Checkout
The Revenue Impact tab is what separates Alhena's ecommerce analytics dashboard from a generic customer support analytics tool. It's native revenue attribution for every AI-assisted conversation. It only appears when your AI profile has product pages connected, but once active, it ties every AI conversation to profitability metrics, and it tracks two types of cart events: items added to cart during an AI-assisted session, and completed purchases during or after that session.
Here's every revenue metric and its formula:
- AI-Assisted Revenue: The sum of cart values (in USD) where the cart type is "checkout." This is confirmed revenue that flowed through an AI-assisted conversation, contributing to your total revenue and visible right on your sales dashboard. Over time, this revenue data compounds. When Tatcha reports that 11.4% of total site revenue comes from AI, this is the metric doing the talking.
- Daily Checkout Revenue (Average): Purchase revenue divided by the number of distinct revenue days in the window. Useful for spotting trends without date-range distortion.
- Total Cart GMV: The sum of all cart values where items were added, before discounts and before checkout completion. This is everything users tried to buy. The gap between Cart GMV and total revenue tells you how much friction exists in your conversion funnel in your purchase funnel. You can visualize this gap between "add to cart" and "complete purchase."
- Daily Cart GMV (Average): Cart GMV divided by distinct GMV days.
- Average Order Value (Daily): Checkout revenue divided by order count, averaged over the window. Victoria Beckham saw a 20% AOV increase with Alhena, and this is the metric that tracked it.
- Total Products in Cart: Items added minus items removed. The net quantity, not the gross.
- Average Products in Cart: Net cart quantity divided by distinct quantity days.
How Revenue Tracking Works for Shopify Stores
If your AI profile is connected to a Shopify store, revenue tracking starts automatically. The system detects the Shopify integration and begins capturing cart and checkout events without any additional setup. For non-Shopify stores running on WooCommerce or other platforms, the same data flows through Alhena's cart event tracking API. Shopify sales data syncs automatically from the moment you connect.
All cart values are normalized to USD, so multi-currency stores roll up cleanly in the dashboard. The raw currency is preserved in the underlying data for drill-downs, but the dashboard always shows you a single, comparable number.
One technical note: the "has revenue data" check is cached for two hours per organization. That's why the Revenue Impact tab sometimes takes a moment to appear after you first enable product pages. It's not broken. It's just waiting for the cache to refresh.
AI Agent CSAT Performance: Where Satisfaction Gets Specific
The CSAT Performance tab goes deeper than a single satisfaction score. For e-commerce brands, this is where satisfaction data becomes actionable. This is where customer support analytics gets genuinely useful, because it breaks satisfaction down by topic and by the specific feedback options customers select.
Here's what the tab surfaces:
- CSAT score per topic: For each conversation topic (tagged by the same LLM classifier), the percentage of 4-5 star ratings out of total ratings. You might have 92% CSAT on "order status" questions but 71% on "returns." That gap tells you exactly where to focus.
- Positive feedback breakdown (4-5 stars): The top structured feedback options selected by happy customers. Tags like "solved my problem" or "fast response" show what's working.
- Negative feedback breakdown (1-3 stars): The top structured feedback options from unhappy customers. Tags like "answer was incorrect" or "didn't understand my question" tell you what to fix, and they tell you at the topic level.
- Raw feedback comments: Paginated text comments from customers, 10 per page. The unfiltered voice of the customer, searchable and browsable.
This is the only place in the product where you learn something like: "Here's the exact tag ('Didn't understand my question') that negative reviewers are picking, and it's concentrated in the 'gift card balance' topic." That level of specificity turns a CSAT score from a vanity metric into a retention action plan.
Manawa improved their CSAT from roughly 80% to 85-86% by using exactly this kind of topic-level feedback loop. They didn't try to improve everything at once. They learned which topics were weakest and fixed those first.
Experiments: Test Before You Commit
The Experiments tab is Alhena's built-in A/B testing surface. You split a percentage of traffic between two AI configurations, including different agentic behaviors, (different prompts, different guidelines, different tone) and the dashboard reports the results side by side.
Three things show up in the experiment view:
- Traffic allocation: The percentage of conversations going to control versus variant.
- Revenue-weighted comparison: The same revenue impact metrics from the Revenue tab, but split by variant. You can see which configuration drives more completed purchases, higher AOV, or better cart GMV.
- Statistical status: Whether the experiment is in progress, has declared a winner, or was abandoned.
This tab is gated behind a feature flag, so not every customer sees it yet. But for teams that want to tie sales performance metrics to specific AI configurations and analyze which prompts drive the most revenue, it's a direct path to data driven insights. But for teams running multivariate tests on their AI, it removes the guesswork from prompt tuning. You're not shipping changes based on gut feeling. You're shipping them based on revenue data.
What Makes This Dashboard Different
Plenty of platforms offer some version of ai chatbot analytics, and tools like Google Analytics or GA4 track page-level behavior, but neither was built for conversation-level e-commerce intelligence. Ecommerce businesses need solutions built for selling, not just ticket deflection. Here's what Alhena's approach does differently:
Revenue Attribution Is Native, Not Bolted On
Most support tools track deflection and CSAT. Native attribution either doesn't exist or requires a third-party integration with manual UTM tagging. In Alhena, revenue tracking is built into the core product. Every AI-assisted cart event and checkout is captured automatically, normalized to USD, and displayed alongside operational metrics. You don't need a separate BI tool to answer "is my AI making money?"
Playground Data Stays Out of Production Metrics
Every CSAT query and topic query automatically excludes Playground conversations. When you're testing new prompts or training configurations in the sandbox, those interactions don't pollute your production numbers. This sounds small, but it's a common integrity problem with ai chatbot analytics: test data mixing with real data and quietly skewing your metrics.
Multi-Profile Rollup in One Toggle
These features matter for customer retention. If you run multiple AI profiles (say, one for pre-sale and one for post-purchase), the "All AI profiles" toggle aggregates everything by organization instead of by individual bot. Same query, one filter removed. You get the org-level view without needing to build custom dashboards or integrate a separate reporting pipeline.
Period-Over-Period by Default
You don't have to set up a comparison view. Every metric automatically shows the percentage change versus the previous equivalent window. Last 30 days versus the 30 days before that. Last week versus the week before. The trend is always visible in real-time, which means your ecommerce dashboard catches regressions the same day they start, not two weeks later in a monthly report.
Permissions That Match Your Org
Credit usage tiles only show for org admins on credit-based pricing plans. These features keep sensitive data scoped correctly. The dashboard is available to org admins and bot profile members, but sensitive billing data is scoped appropriately. This matters more than you'd think when you have 15 people logging into the dashboard daily.
What You'd Learn in Your First Week
Numbers on a screen are only useful if they change your process and drive real improvements. Here are three data driven scenarios where the Alhena ecommerce analytics dashboard helps you analyze what's happening and act on performance metrics:
Scenario 1: Topic Spike Reveals an FAQ Gap
Your Trending Topics tab shows "shipping delay" conversations jumped 3x this week. You drill into the conversations and see customers asking about a specific carrier. Your FAQ doesn't mention that carrier. Maybe it's a fulfillment delay or an inventory issue with a specific carrier. You add a knowledge base article about that carrier, and the spike flattens within 48 hours. Without the topic view, you'd have found out from a CSAT drop two weeks later, missing the potential to boost resolution speed.
Scenario 2: Low CSAT on Returns Points to Outdated Knowledge
The CSAT Performance tab shows 91% satisfaction overall for your users, but "returns and exchanges" is sitting at 68%. The negative feedback tags cluster around "answer was incorrect." You check your returns policy in the knowledge base and find it still references last quarter's 30-day window. Your policy changed to 14 days. You update it, and CSAT for that topic climbs back to 87% within a week.
Scenario 3: Cart GMV Up, Checkout Revenue Flat
The Revenue Impact tab shows Total Cart GMV growing steadily, but AI-Assisted Revenue is flat. People are adding items through the AI but not completing purchase. Cart abandonment is climbing, and sales are stalling. You check your purchase flow and find a broken discount code field on mobile. Fixing it will reduce cart abandonment, and the Revenue Impact tab shows the change within days. Fix it, and purchase revenue catches up to GMV within days. That's direct attribution of improvements to a single fix. You optimize the purchase flow based on real data, and the dashboard proves it worked. The ROI on that single fix pays for the platform for a quarter.
These aren't hypothetical. They're the kinds of patterns that Alhena customers find in their first week because the data is centralized and organized around decisions and actionable insights, not just displays. The features are built to track profitability trends, drive retention, increase repeat purchases, and support data driven CX decisions across every stage of the customer lifecycle. Revenue attribution, CSAT scores, and topic trends all sit alongside conversation-level data, giving you the full picture for data driven decisions.
See Your Own Numbers
Every metric described in this post is live in the Alhena ecommerce dashboard from day one. No custom solutions needed, no multi-step onboarding process. No GA4 configuration, no setup wizards, no "contact us for analytics," no waiting for a data team to build custom reports. You connect your store, deploy your AI profile, and the product metrics start flowing for free.
Ready to see what your ecommerce analytics dashboard should actually look like? Book a demo with Alhena AI and we'll walk through your numbers live. Or start for free with 25 conversations and explore the dashboard yourself.

Frequently Asked Questions
What metrics does the Alhena AI analytics dashboard track?
The dashboard tracks five categories of metrics across dedicated tabs: Agent Performance (conversation volumes, resolution rate, CSAT), Trending Topics (conversation topic volumes and trends), Revenue Impact (AI-assisted checkout revenue, cart GMV, average order value), CSAT Performance (satisfaction scores broken down by topic and feedback tags), and Experiments (A/B test results with revenue-weighted comparisons).
How does Alhena AI attribute revenue to AI-assisted conversations?
Alhena tracks two types of cart events: items added to cart during an AI-assisted session and completed checkouts during or after that session. For Shopify stores, this tracking starts automatically on connection. All values are normalized to USD for consistent cross-currency reporting. Tatcha attributes 11.4% of total site revenue to AI using this method.
Can I see analytics across all my AI profiles at once?
Yes. The "All AI profiles" toggle aggregates metrics by organization instead of by individual bot profile. The dashboard uses the same underlying queries but drops the individual profile filter, giving you an org-wide view without needing a separate reporting pipeline.
How is CSAT calculated in the Alhena dashboard?
CSAT is calculated as the percentage of 4-5 star ratings out of total ratings collected. The CSAT Performance tab breaks this down further by conversation topic, so you can see which topics drive high satisfaction and which need attention. It also shows the specific structured feedback tags that customers select.
Does Alhena's ecommerce analytics dashboard work with Shopify?
Yes, and Shopify gets a head start. When your AI profile is connected to a Shopify store, revenue tracking begins automatically with no additional configuration. Cart events and checkout completions are captured natively. Non-Shopify stores use Alhena's cart event tracking API for the same data.
What is the difference between Cart GMV and AI-Assisted Checkout Revenue?
Cart GMV represents everything users added to their cart during AI-assisted sessions, before discounts and before checkout completion. AI-Assisted Checkout Revenue counts only completed purchases. The gap between these two numbers tells you how much friction exists between add-to-cart and completing a purchase.
How does the Trending Topics tab identify conversation topics?
An LLM classifier tags every conversation with relevant topics automatically. The Trending Topics tab aggregates these tags to show volume per topic, daily trends and trend lines, geographic and URL breakdowns per topic, and a drill-down view into individual conversations.
Can I run A/B tests on my AI configuration through the dashboard?
Yes. The Experiments tab lets you split traffic between two AI configurations with different prompts, guidelines, or tone, then compare results. The dashboard shows traffic allocation, revenue-weighted performance for each variant, and statistical status indicating whether a winner has been declared.
How fast does the Alhena analytics dashboard load?
The dashboard loads in under two seconds, even across millions of conversations. Alhena pre-aggregates data into partitioned BigQuery tables rather than querying raw event logs at view time. Parameterized queries also enable efficient caching.