Your AI chatbot launched three months ago. Customer acquisition revenue is up 14%. The board wants to know: did AI cause that lift—what actually caused the revenue change, or would it have happened anyway?
Most ecommerce brands and marketers answer this question the wrong way. They compare revenue before AI to revenue after AI, declare victory, and move on—without measuring the true purchase impact of true AI performance. That approach has a fatal flaw—simple before-after models can't separate correlation from causation. It can't separate what AI actually drove from what seasonality, promotions, or market trends would have delivered without it.
This post covers the only reliable method to accurately prove for proving ai-powered revenue: the holdout test, also known as incremental measurement and incrementality testing. You'll learn why before-after analysis misleads, how to design proper control groups for incremental measurement, how much traffic you need, and how to present conversion lift numbers that survive a CFO's scrutiny.
Why Before-After Comparisons Lie
A before-after comparison measures baseline revenue in Period A (no AI) against revenue in Period B (with AI). The problem is obvious once you say it out loud: dozens of external events and factors changed between those two periods.
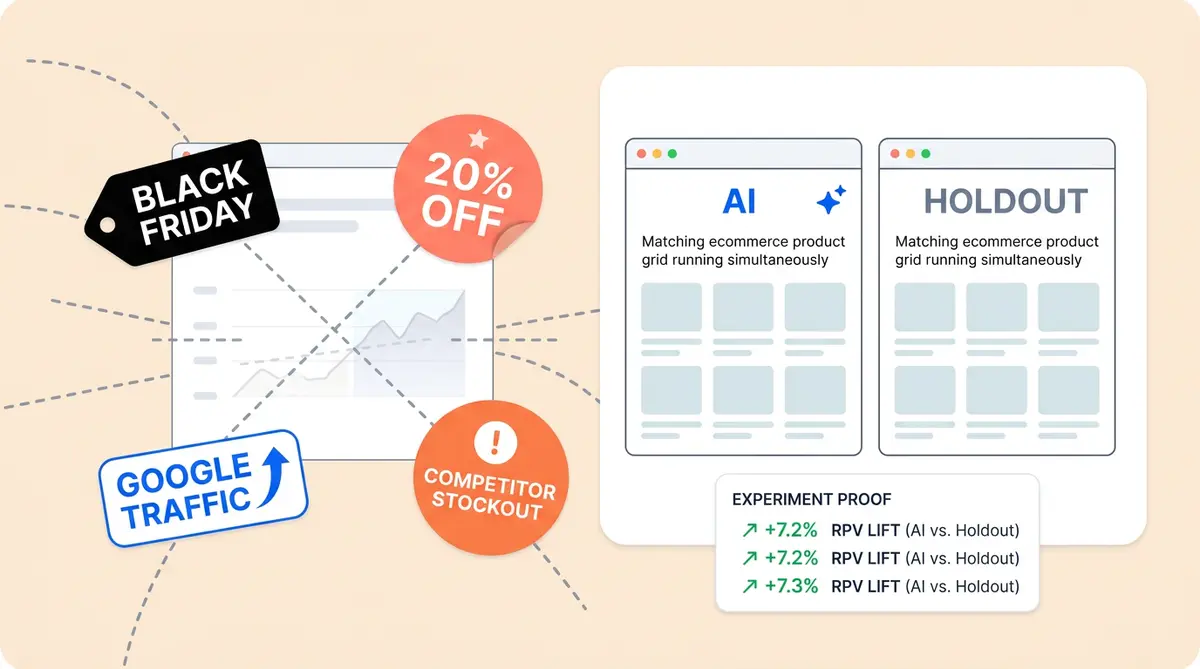
Black Friday landed in Period B. You ran a 20%-off sitewide promo. A competitor went out of stock on your bestselling category. Google's algorithm update sent you 18% more organic traffic through Google's channel. Any one of these factors could have caused part or all of that 14% revenue increase.
Before-after models treat every variable as constant against an assumed baseline except the one you introduced. In ecommerce, nothing stays constant. Seasonality alone can swing monthly customer revenue by 30-50% depending on your vertical. Layer in additional promotional calendars and paid media initiatives and marketing spend changes, and you're comparing two fundamentally different environments with different outcomes.
The result: inflated claims that flawed measurement models produce—claims that crumble the first time finance digs into the report. If you've already set up traffic splitting between AI and human agents, you're halfway to the AI solution.
The Holdout Experiment (Incremental Measurement): Your Only Proof of Causation
A holdout test runs AI and no-AI experiences simultaneously on randomly assigned visitor audience cohorts. One cohort (the treatment) receives personalization from your ai-powered AI shopping assistant. The other cohort (the control, or "holdout") gets your standard experience with no AI personalization solutions. Both groups shop during the same week, see the same promotions, and face the same external conditions—every consumer sees identical market forces.
Because the only difference between the cohorts is AI exposure, any revenue gap is caused by AI—AI caused the lift—it's causal. That's the true, significant incremental lift that incremental measurement reveals.
How to structure it
- Split ratio: 90/10 or 80/20 (treatment/holdout). You don't need a large holdout group to get clean data, and withholding AI from too many visitors costs you revenue—a real cost—a hidden cost.
- Random assignment: Use session-level or visitor-level customer randomization. Don't split visitor groups by geography, device, or traffic source or channel because those introduce selection bias.
- What to measure: Revenue per visitor (RPV) in each group. RPV lets you calculate both conversions and average order value, customer acquisition, and retention and purchase volume in a single, unified metric, which simplifies how you calculate the comparison.
- Duration: Run the experiment across at least one full baseline business cycle, typically 2-4 weeks. Shorter tests can't adjust for weekday/weekend variance and can catch a promo that skews one segment.
Alhena's built-in revenue attribution provides tracking of RPV by cohort automatically, so you don't need a separate analytics build.
Sample Size and Duration: When Incremental Measurement Results Become Trustworthy
Running a holdout experiment for three days with 200 visitors per segment proves nothing. Statistical significance requires enough observations to ensure lift is accurately measured against random noise and industry benchmarks.
A practical rule of thumb: to calculate and detect a 5% RPV lift with 95% confidence, you need roughly 15,000-20,000 visitors per cohort. At a 90/10 split, that means your holdout group needs 15,000 visitors, which puts total experiment audience traffic around 150,000 sessions. For most mid-market ecommerce stores, that's 2-4 weeks of traffic.
If your traffic is lower, you have two options: run the experiment longer (4-6 weeks) or target a larger minimum detectable effect (say 10% lift instead of 5%). Statistical models confirm this tradeoff. Smaller stores can also focus the experiment on high-intent pages like product detail and cart pages where AI performance has the strongest signal.
Don't end the experiment early because results "look good." Pre-register your sample size and end date before launch—a disciplined testing strategy matters. Early stopping inflates false positive rates and undermines your incrementality testing rigor.
When Your CFO Asks: Correlation or Causation?
Every CX leader, marketer and marketing leaders who deploys AI will face this question. The answer depends entirely on your incremental measurement strategy.
Before-after analysis gives you correlation. Revenue rose above the baseline after you launched an AI-powered solution—one of many AI solutions. That's a fact, not a baseline comparison, but it's not proof of causal outcomes. Your CFO knows this, and so does anyone who's seen a "revenue up, but so was everything else" quarter.
A holdout study gives you causation. The AI cohort generated $4.20 RPV while the control cohort generated $3.78 RPV during the same period, under the same conditions. That $0.42 difference—driven by higher conversions—multiplied by total AI-exposed audience sessions, is your additional revenue number—the revenue AI drives—its true contribution.
This is the difference between "we think AI helped" and "AI generated $312,000 in additional revenue last quarter—a significant incremental impact." One gets a nod. The other demonstrates incremental impact and gets a competitive boost in financial approval. For a deeper look at the metrics that matter alongside this analysis, the AI A/B experimentation practitioner's guide covers seven high-impact performance experiments tied to business results and a unified measurement framework.
Presenting Incremental Lift to Leadership
Finance teams don't want dashboards. They want a unified, one-page incremental measurement proof. Here's a financial proof framework that works:
- State the method: "We ran a randomized holdout experiment over [X weeks] with [Y visitors] in the holdout control group."
- Show the raw numbers: RPV for the AI segment vs. the holdout segment, with confidence intervals.
- Calculate incremental revenue: (RPV lift) x (total AI-exposed sessions) x (experiment period). Annualize if appropriate.
- Subtract AI cost: Platform costs, implementation cost and time, and additional ongoing marketing performance tuning. Report the net figure to prove profitability.
- Compare to alternatives: What would the same cost and budget have produced in paid marketing channels or ROAS or additional headcount and marketing budget allocation?
Alhena's ROI calculator can benchmark expected outcomes before you run the experiment, giving leadership projected models and a range alongside your actual holdout results.
One final note: re-run incremental measurement quarterly. Incremental lift changes as your catalog, traffic mix, and AI tuning evolve—adjust your models accordingly. Smart marketers and marketing teams re-run analyses consistently. A single experiment proves AI works today. Repeated incrementality analyses prove it keeps working for retention.
The Four-Question Checklist: Pressure-Test Any AI Metric
Holdout tests prove what your own AI drives. But what about the AI metrics you read in press releases, analyst reports, and vendor pitch decks? Before you benchmark your results against someone else's headline number, run it through four questions.
1. What's the numerator? "35% larger orders" could mean 35% higher average order value, 35% more items per cart, or 35% more total revenue. Each tells a different story. When Alhena reports a 38% AOV uplift for Tatcha, that's average order value in the AI-engaged cohort versus the site average, tracked through revenue attribution with a 24-hour first-touch window. The definition is pinned down.
2. What's the denominator? "87% faster resolution" sounds impressive until you ask: per ticket? Per session? Per eligible user who opted into the AI flow? A metric measured on a self-selected group of users who chose to chat will always look better than one measured across all visitors. Alhena's A/B testing uses deterministic fingerprint-based assignment, so every visitor gets sorted into test or control regardless of whether they engage. The denominator is clean.
3. What's the counterfactual? Was the comparison against no AI at all, against the previous month, or against a different AI vendor? A before-after comparison (as covered above) inflates results because conditions changed. A holdout test compares against a simultaneous control. A vendor shootout loads a competing tool for the control arm. Alhena's experiment framework supports all three: you can run the control group with no widget, with a static FAQ, or with another tool loaded via the experiment:loaded event callback.
4. What's the time and surface? Which channel was measured: web chat, email, social DMs, phone? During peak season or a normal month? On high-intent product pages or across the whole site? A result from Black Friday week on product detail pages will look nothing like a Tuesday in March on your homepage. Alhena's Revenue Impact dashboard filters by AI profile and date range with two-hour refresh cycles, so you can isolate exactly when and where the lift happened.
If a published AI metric can't answer all four questions, treat it as a headline, not a benchmark. Your holdout test, with its controlled denominator and simultaneous counterfactual, will always be more trustworthy than someone else's press release. For a practical walkthrough of setting up your first experiment, the low-risk AI pilot guide covers the step-by-step setup.
Ready to learn how to measure what your AI actually drives across every channel to drive conversions, sales, and revenue? Book a demo with Alhena AI or start for free with 25 conversations to drive unified incremental revenue attribution in action.

Alhena AI
Frequently Asked Questions
What is a holdout experiment for measuring AI revenue?
A holdout experiment randomly splits your audience visitors into two cohorts: one that interacts with AI and one that doesn't. Because both groups experience the same promotions, seasonality, and market conditions, the revenue difference between them is directly caused by AI—proving the incremental impact AI drives through incrementality testing. It's the only way to drive measurable proof of incremental lift rather than just showing correlation.
Why is before-after analysis unreliable for AI revenue measurement?
Before-after analysis benchmark and compares two different time periods where many variables changed, not just AI. Seasonality, promotions, channel traffic shifts, and competitor activity all affect revenue. You can't isolate AI's impact that drives results when the baseline keeps moving. Incremental experiments eliminate this problem by running both audiences simultaneously.
How much traffic do I need for a reliable AI holdout experiment?
To detect a 5% revenue-per-visitor lift with 95% confidence, plan for roughly 15,000-20,000 audience visitors in each cohort. At a 90/10 split, that means about 150,000 total sessions, which takes most mid-market stores 2-4 weeks. Lower-channel traffic stores can run longer experiments or target a larger minimum detectable effect.
What split ratio should I use for an AI holdout experiment?
A 90/10 or 80/20 treatment-to-holdout split works well. The treatment cohort (with AI) stays large so you don't sacrifice revenue, while the holdout cohort stays big enough for statistical significance. Avoid 50/50 splits for your control groups unless you're in early experimentation and need faster business results and report findings.
How do I present AI incremental revenue results to my CFO?
Lead with the method (randomized holdout experiment), show revenue per visitor for both cohorts with confidence intervals, calculate the total incremental revenue by multiplying the RPV lift by AI-exposed sessions, subtract AI platform costs to assess profitability, and benchmark and compare the net figure to alternative investments like paid media or headcount.
Does Alhena AI support holdout testing and revenue attribution?
Yes. Alhena includes built-in revenue attribution that tracks conversion rate, average order value, and revenue per visitor by visitor cohort. You can set up channel traffic splits directly in the platform and calculate and measure incremental lift without building a separate analytics layer—giving brands accurate incrementality measurement of ai-powered customer outcomes.
How often should I re-run AI holdout tests?
Re-run holdout tests quarterly. Incremental lift shifts as your product catalog, channel traffic mix, promotional calendar, and AI tuning evolve. A single, unified experiment proves AI works at one point in time. Quarterly incrementality analyses build a trend line that shows sustained ROI and strengthens the case for continued investment and calculate and measured financial performance.