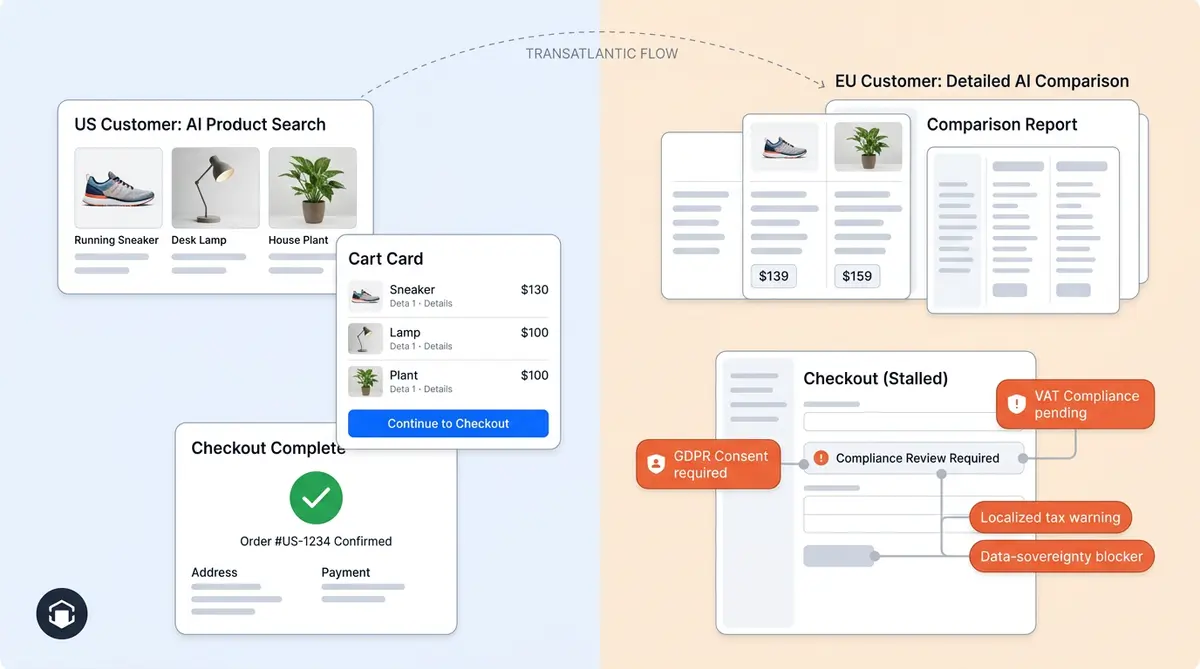
EU ecommerce brands convert LLM traffic at 0.41% on a blended average, against 3.50% in the US. But EU pure-ecommerce brands already hit 1.85% to 3.18%. The 8.5x gap is an infrastructure gap, not a European shopper problem.
That distinction is the whole story. Across 329 retailers Alhena AI tracked from Q4 2024 through Q1 2026, the headline transatlantic spread looks like proof that Europeans will not buy through AI. Isolate the DTC storefronts and the number collapses to something close to US performance.
So the useful question for a European ecommerce team is not whether AI traffic converts here. It is which of three fixable layers is holding your own number down.
What conversion rate should EU brands actually expect from AI traffic?
The blended average is the wrong number for almost every DTC brand reading it.
Here is the full picture from the 329-brand dataset, split by region and vertical. The spread within Europe is wider than the spread between the two continents.
| Segment | Region | LLM conversion rate | What it tells you |
|---|---|---|---|
| Beauty & skincare | US | 5.36% | Ceiling for mature DTC deployment |
| Health & supplements | US | 4.68% | High-repeat, high-AOV categories |
| Blended portfolio | US | 3.50% | The headline US figure |
| Beauty & skincare | EU | 3.18% | Within 40% of the US blended rate |
| Fitness equipment | EU | 1.85% | 4.5x the EU blended average |
| Blended portfolio | EU | 0.41% | Dragged down by non-retail properties |
A note on datasets, because two Alhena studies circulate. The 329-brand study (Q4 2024–Q1 2026) puts blended LLM conversion at 2.47% across all regions. A later 310-brand study, running through April 2026, reports 2.68% for US storefronts specifically. Different cohorts, different windows, same direction of travel. Regional figures on this page all come from the 329-brand set. The full channel ranking sits in the 329-brand benchmark report.
Is the 8.5x gap a demand problem or a deployment problem?
One idea: the two portfolios are not measuring the same kind of business.
Deployment, and it is not close. The gap starts with what is inside each regional cohort before any behaviour is measured.
The US side of the dataset skews heavily toward direct-to-consumer beauty, skincare, and supplements. High AOV, rich structured product data, checkout as the single primary action on every page.
The EU side carries a higher share of SaaS properties, B2B storefronts, and marketplace platforms. On many of those, checkout is not the conversion event at all, so a "conversion rate" measured against it will always look broken.
Strip those out and European shopper intent looks ordinary. EU consumers research products in ChatGPT, Perplexity, and Google AI Overviews at rates broadly comparable to US consumers. The drop-off is not at research. It is between research and purchase, and that stretch is built from infrastructure.
Why do US DTC brands convert AI traffic higher?
Three deployment differences compound on top of the vertical mix.
1. Checkout maturity
US DTC brands have spent years compressing checkout into single-page flows, one-click purchase, and post-add-to-cart upsells. When an AI assistant recommends a product there, the path from recommendation to paid is roughly two clicks.
Many EU storefronts still route the same shopper through account-creation gates, multi-step address entry, and payment options that fragment across 27 member states. That fragmentation is real and it is not going away, but it is a localisation problem with a known playbook, not a ceiling.
2. Deployment quality: proactive versus reactive
The highest-converting US brands run assistants that trigger on scroll depth, exit intent, dwell time, and cart contents, placed above the fold on product pages. Proactive placement converts at roughly 2x reactive, help-icon placement across comparable verticals.
Most underperforming EU deployments are the reactive kind: a support widget parked in the corner, waiting to be found. The mechanics of that gap are broken down in the proactive engagement study.
3. Product data depth
US retailers feed their assistants ingredient lists, sizing guides, comparison matrices, and review summaries. Earlier-stage EU deployments often connect little more than title, price, and stock status.
An assistant can only be as specific as its catalogue. Thin data produces vague recommendations, and vague recommendations do not close.
What are the three layers of the EU infrastructure gap?
All three are closeable, and none require rebuilding the stack.
Checkout maturity
One-click paths, fewer gates, localised payment. Executable on Shopify or WooCommerce inside a quarter.
Deployment quality
Reactive widget to proactive agent with intent triggers and agentic cart-building. A configuration change, not a rebuild.
Product data depth
Multilingual descriptions, regional sizing, ingredient transparency, structured attributes LLMs can parse.
How far behind the US is Europe, really?
Roughly 12 to 18 months on AI commerce infrastructure — and the clock is already running.
That estimate covers the full stack: checkout modernisation, assistant deployment patterns, and catalogue enrichment. It is not a single metric.
One visible input is discovery-surface rollout. Google AI Overviews reached the US in 2024 and expanded across EU countries around nine to ten months later. Assistant deployment maturity and checkout modernisation lag by more, which is what pushes the blended estimate to 12 to 18 months.
Read that as a window rather than a verdict. Most EU competitors are still benchmarking against 0.41% and concluding the market is not ready, which is precisely what makes the window open.
How do you tell which stage your market is in?
Three stages, each with measurable thresholds you can check this week.
| Signal | Stage 1 · Experimental | Stage 2 · Transitional | Stage 3 · Established |
|---|---|---|---|
| Typical markets | Most EU markets today | Nordics, UK, select EU DTC | US DTC beauty, health, apparel |
| LLM share of site traffic | < 0.5% | 0.5% – 2% | 2% – 5% |
| QoQ LLM traffic growth | 20% – 40% | 40% – 80% | Sustained, compounding |
| AI engagement rate | < 5% | 8% – 15% | > 15% |
| AI-assisted conversion | < 1% | 1.5% – 3% | > 3% |
| What AI is used for | Research and comparison only | Research plus first purchases | Purchase completion at scale |
| Commercial status | Experiment | Budget line under review | P&L line item |
Which leading indicators mean you are about to tip into Stage 2?
Check all four. Three or more means your market is moving now, not next year.
- LLM traffic growth crosses 50% quarter over quarter. Acceleration matters more than absolute volume at this stage.
- AI engagement rate crosses 5% of total site visitors interacting with the assistant.
- Your first vertical-specific conversion rate crosses 1.5%, even if the site-wide number is still under 1%.
- AI-assisted AOV exceeds non-AI-assisted AOV by 15% or more. This is the earliest reliable signal, and it usually appears before conversion moves.
That last one is the tell. Tatcha recorded a 38% AOV uplift at this point in its curve, and later reported 11.4% of total site revenue flowing through Alhena AI once it reached Stage 3.
What should EU teams do in the next two quarters?
A sequenced plan, ordered by speed-to-impact rather than by effort.
- Re-benchmark against your vertical, not the portfolio. If you sell beauty in Germany, your target is 3.18%. Fitness equipment in the Netherlands, 1.85%. Pull your comparison set from the vertical performance breakdown before you set any goal.
- Move the assistant from reactive to proactive. Above-the-fold placement on product pages, triggers on scroll depth and exit intent, and cart-building rather than link-handing. This is a configuration change and typically the single largest jump available.
- Instrument attribution before you optimise. You cannot manage a channel you cannot see. Separate AI-assisted sessions in reporting so the AOV signal above becomes visible. The method is covered in AI search revenue attribution.
- Enrich the catalogue for European language queries. Multilingual descriptions, regional sizing equivalents, ingredient transparency, and structured attributes. This improves both assistant accuracy on-site and citation odds off-site — see multilingual AEO for the discovery-side detail.
- Cut checkout friction on the AI path specifically. Remove account-creation gates and compress address entry for sessions arriving from LLM referrals, before attempting a site-wide checkout project.
Which benchmark should you hold your team to?
Pick the row that matches your business model, not your postcode.
| If you are… | Ignore | Target instead |
|---|---|---|
| EU DTC beauty or skincare | 0.41% | 3.18% |
| EU DTC fitness, equipment, or home | 0.41% | 1.85% |
| EU DTC health or supplements | 0.41% | Track toward 3%+ (US peers: 4.68%) |
| EU marketplace, B2B, or SaaS | Any checkout conversion figure | Qualified-lead or assisted-session rate |
| US DTC already above 3.50% | Blended averages entirely | Stage 3 thresholds: >15% engagement |
How do you find where your brand sits on the curve?
Geographic intelligence: your rate, against your vertical, in your region.
Closing the gap needs more than a better widget. It needs to know which of the three layers is actually costing you, which is a comparison problem before it is an engineering one.
Alhena AI is built on performance data from 329 storefronts across both markets, so brands can see regional benchmarks by vertical, which deployment configurations drive the highest rates, and how much revenue is flowing through AI-assisted sessions.
On the deployment side, the Product Expert Agent handles proactive engagement and agentic cart-building, and every recommendation is grounded in verified catalogue data rather than generated — which matters disproportionately in Europe, where hallucinated product claims erode trust fastest. Both it and the Order Management Agent deploy in under 48 hours on Shopify, WooCommerce, and Salesforce Commerce Cloud. For the discovery half of the journey, Alhena AI Visibility covers whether your brand gets surfaced before the click happens at all.
Results span both regions. Victoria Beckham recorded a 20% AOV increase. Puffy reached 63% automated inquiry resolution at 90% CSAT. Crocus hit an 86% deflection rate while holding 84% CSAT.
Key takeaways
- The 8.5x gap is structural, not behavioural. It reflects dataset composition, checkout maturity, deployment quality, and product data depth — not European reluctance to buy through AI.
- EU pure-ecommerce brands already convert at 1.85% to 3.18%. European willingness exists today; the infrastructure to capture it does not exist at scale yet.
- The gap is three closeable layers. Checkout maturity, deployment quality, and product data depth. Deployment quality is the fastest lever and needs no replatform.
- Europe is roughly 12 to 18 months behind on infrastructure. Discovery-surface rollout lags by about nine to ten months; the rest of the stack accounts for the remainder.
- Benchmark against your vertical, never the blended average. 0.41% is the wrong target for essentially every DTC brand that reads it.
- Watch AOV before conversion. AI-assisted AOV exceeding non-AI AOV by 15%+ is the earliest signal a market is tipping from Stage 1 to Stage 2.
Find your real benchmark
See where your brand sits on the AI maturity curve against peers in your vertical and region — and which of the three layers is costing you most.
Frequently asked questions
The blended EU average is 0.41% across Alhena AI's 329-brand dataset, but that figure includes SaaS, B2B, and marketplace properties where checkout is not the primary action. Isolated to pure ecommerce, EU fitness equipment brands convert LLM traffic at 1.85% and EU beauty brands at 3.18%. DTC brands should benchmark against the vertical figure, not the blended one.
The gap is structural rather than behavioural. The US cohort skews toward DTC beauty and health brands with mature two-click checkouts, proactive above-the-fold assistant placement, and deep catalogue integration. The EU cohort contains more non-retail properties and more early-stage, reactive deployments. European shopper intent is comparable; the path from research to purchase is longer.
Yes, in the segments where the infrastructure exists. EU beauty brands converting AI traffic at 3.18% sit closer to the US blended rate of 3.50% than to the EU average of 0.41%. Where it is not working, the cause is almost always reactive assistant placement, thin product data, or a checkout flow with account gates — all three fixable without replatforming.
Roughly 12 to 18 months on infrastructure maturity across checkout, deployment, and catalogue depth. Discovery surfaces lag less — Google AI Overviews reached EU countries about nine to ten months after the US. Individual brands can close their own gap much faster, since deployment configuration changes take days rather than quarters.
Four leading indicators: LLM traffic growth above 50% quarter over quarter, AI engagement crossing 5% of site visitors, the first vertical-specific conversion rate crossing 1.5%, and AI-assisted AOV exceeding non-AI AOV by 15% or more. The AOV signal typically appears first. Alhena AI tracks these across 329 brands and maps them to regional maturity stages.
Across comparable verticals, proactive deployment converts at roughly 2x the rate of reactive, help-icon deployment. The difference is placement and timing: triggering on scroll depth, exit intent, and cart contents above the fold, versus waiting to be discovered in a corner. For most EU brands, this is the single largest available jump and the cheapest to make.
Enrich catalogues with multilingual descriptions across the EU's 24 official languages, regional sizing equivalents, ingredient transparency data, and structured attributes that LLMs can parse. This improves on-site recommendation accuracy and off-site citation odds when shoppers research in French, German, Dutch, or Spanish. Assistants can only be as specific as the catalogue behind them.
Alhena AI provides regional conversion benchmarks by vertical and geography, deployment optimisation data showing which configurations drive the highest rates, and revenue attribution broken down by market. The Product Expert Agent and Order Management Agent deploy in under 48 hours across Shopify, WooCommerce, and Salesforce Commerce Cloud, with every recommendation grounded in verified catalogue data.