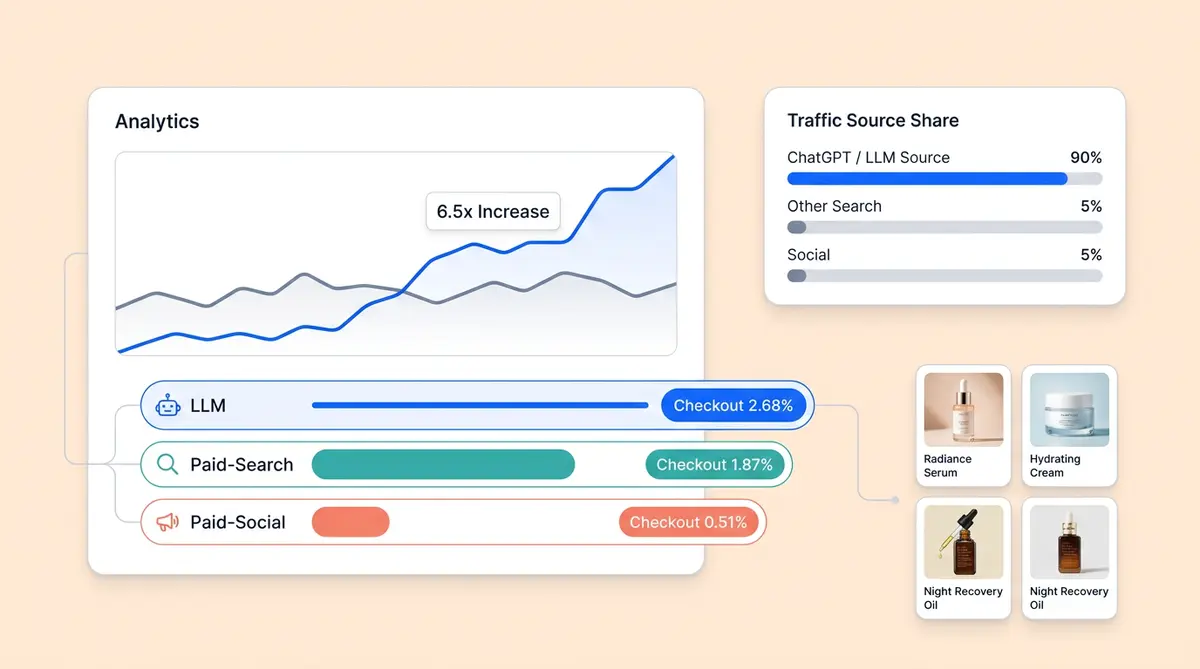
LLM-referred traffic to online stores grew 6.5x in the 12 months from May 2025 to April 2026, measured on a like-for-like cohort of US brands tracked continuously across the full period. That is a 550% increase in a single year — and it happened while total traffic to those same brands stayed flat.
The growth is a channel shift, not brand growth.
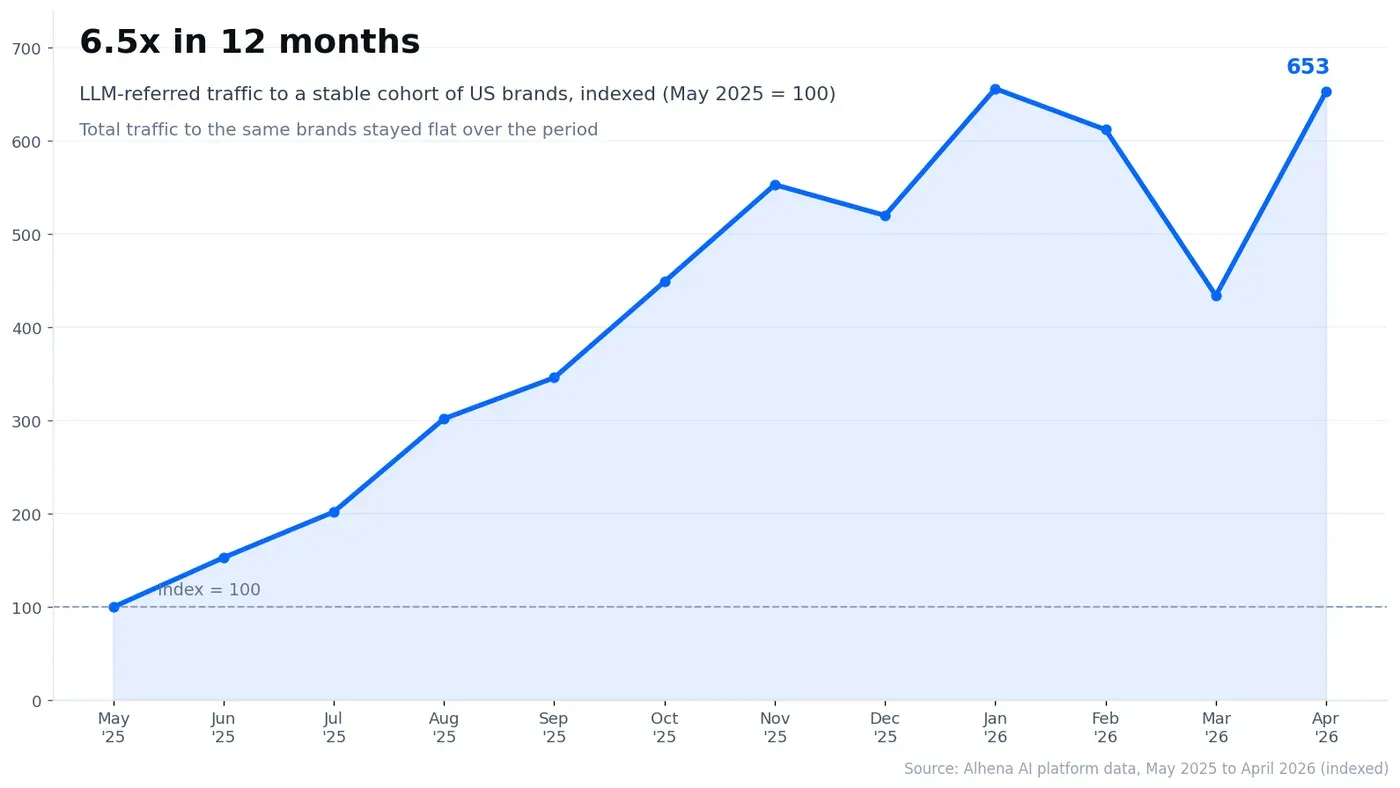
This is not a forecast. It is a measurement of what already happened, drawn from a first-party dataset of roughly 310 retail brands and about 190 million visitors.
The numbers come from Alhena's own on-site shopping and support agents, which observe how visitors arrive, what they ask, and whether they check out. Every figure below carries its population and window, because a channel this new is easy to overstate.
Data as of April 2026. Published July 2026. This is a new cohort and a longer window than our earlier State of AI Commerce report; the two are not directly comparable, and we explain why below.
Alhena publishes this research and sells the AI Visibility and AI Shopping products that generated the underlying data. We hold our own numbers to the same evidence standard we would apply to anyone else's, and we print the limitations in full.
Key takeaways
- LLM-referred traffic grew 6.5x (550%) in 12 months on a stable US cohort — a channel shift, not portfolio growth.
- The channel converts at 2.68%, ahead of Google Ads and Meta Ads, at zero media cost.
- ChatGPT is 96.1% of volume, but Perplexity, Copilot, Gemini and Claude behave differently enough that a single "LLM" number hides the picture. Measure by provider.
- Most brands undercount this channel badly: UTM-tagged ChatGPT visits outnumbered referrer-identified ones roughly ten to one.
- AI-referred shoppers arrive to compare and ask for a recommendation, not to open a support ticket.
- Fewer than 1 in 10 US brands hold most of the value today, so the opportunity for everyone else is still open.
What is in the dataset?
Approximately 310 retail brands across the US and EU, about 190 million unique visitors (189.76M), 1.6 million checkouts, and $260.6M in observed checkout volume, from May 2025 through April 2026.
Visitor and channel data cover the full 12 months. Conversion data is reliable from October 2025 onward, when our cross-brand checkout instrumentation reached portfolio-wide deployment — so every conversion, AOV and topic figure below is scoped to that shorter window and labelled as such.
We can join arrival channel to purchase in one system because the data comes from our own on-site agents rather than from crawling the web. That first-party vantage point is the same one behind our first-party AI visibility intelligence: the visitor lands from an AI engine, we see what they do, and whether they check out.
Growth comparisons use a stable cohort — brands active in both May 2025 and April 2026 with at least 1,000 visitors in each month. That is 30 US and 8 EU brands. Holding the brand set constant separates a real channel shift from new-brand onboarding.
How fast is LLM traffic to online stores actually growing?
On the stable cohort, LLM-referred traffic grew 6.5x between May 2025 and April 2026, a 550% increase. Over the same period, total visitor volume across those exact brands moved only from 3.31 million to 3.43 million per month.
Measured as a share of all traffic, LLM referrals went from 0.038% of visitors to 0.237% on the US cohort — a 6.3x increase in channel share. Established channels rarely move share by more than 10 to 20% in a year. A 530% move signals a channel that did not exist at scale twelve months earlier.
ChatGPT drove almost all of it. On the same cohort, ChatGPT-referred visitors grew 6.6x (1,134 to 7,489 per month) while Perplexity grew 2.2x (111 to 245). The AI referral market is consolidating toward ChatGPT faster than the other engines are entering it.
Why we don't use the 29x number
Across the full 310-brand portfolio, LLM-referred visits grew about 29x year over year. We label that as gross growth, because most of the gap between the cohort's 6.5x and the portfolio's 29x is new brands onboarding to AI-commerce tracking, not per-brand demand.
The defensible number is the cohort-normalised 6.5x. We are publishing the smaller figure on purpose.
The EU told a quieter story
The 8-brand EU stable cohort grew just 1.1x over the same 12 months (3,907 to 4,325 monthly LLM visitors). This is a US-led shift for now, and we say so plainly rather than blending the two regions into a flattering global average.
Do LLM-referred shoppers actually convert?
They do, at a rate that outperforms most paid media. In the US over the October 2025 to April 2026 reliable window, LLM/AI traffic converted at 2.68% — fourth of 13 tracked channels with at least 50,000 visitors.
That beat Google Ads at 1.87% and was more than five times Meta Ads at 0.51%, two channels carrying billions in annual spend while the LLM channel costs the brand nothing per referral.
The LLM channel's average order value was about $69 in the US over the reliable window, below the portfolio-wide $156. That reflects the smaller-basket categories AI recommends most today — beauty, skincare and accessories — rather than a lower-value shopper.
One pattern deserves care. LLM-referred visitors who engaged with our on-site assistant converted at about 4.3x the rate of those who did not. That is an engaged-versus-unengaged comparison, not a controlled test: shoppers who choose to engage are already further along, so this is an association, not proof the assistant caused the lift.
Why is your own AI traffic number probably too low?
Because most analytics setups count the channel one way, and it arrives another.
In one 40-day platform-wide window, UTM-tagged ChatGPT visits outnumbered referrer-identified ones by roughly ten to one. A setup that identifies AI traffic by referring host alone would have missed most of the channel.
This is the most consequential measurement finding in the dataset, and it explains a pattern we hear constantly: a brand reports AI referrals as a rounding error, then finds a far larger number once both signals are checked.
Three separate effects push reported AI traffic and revenue below the true figure:
- Referrer-only classification misses roughly nine in ten ChatGPT visits, because many arrive UTM-tagged rather than with an identifiable referring host.
- Unmatched checkouts. About 25% of checkout events in this dataset could not be joined to a visitor, so conversion rates are understated.
- Cross-month purchases are dropped. A shopper who lands in October and buys in November is not credited to the channel under our same-month model.
The second and third effects apply uniformly across channels, so the conversion table's ordering holds even though the absolute rates are conservative. The first does not — it is specific to AI traffic, which makes the LLM channel the one most likely to be undercounted in a standard analytics setup.
Which AI engines send the traffic, and which send the money?
ChatGPT dominates volume, but it does not have the highest-value shopper. Over 12 months in the US it accounted for 96.1% of LLM-referred traffic; every other engine combined made up under 4%.
Behaviourally, though, "LLM traffic" is not one audience.
| Engine | Share of US LLM traffic | Average order value | Note |
|---|---|---|---|
| ChatGPT | 96.1% | $71 | Volume leader; almost the entire channel |
| Perplexity | 2.6% | $129 | 82% higher AOV than ChatGPT; research-driven |
| Copilot | 0.7% | $64 | Converts at 2.56%, on par with ChatGPT |
| Gemini | 0.3% | $124 | High AOV, low volume |
| Other LLMs | 0.2% | $164 | Kagi, you.com, Brave, Meta AI, character.ai |
| Claude | 0.1% | $295 | Highest AOV; small sample, directional only |
Share reflects 12-month US LLM traffic. AOV reflects the October 2025 to April 2026 reliable conversion window. Claude's AOV is based on 188 visitors and should be read as directional, not statistical.
Perplexity shoppers spent 82% more per order than ChatGPT shoppers — $129 versus $71 — consistent with a research-oriented user base doing comparison work before they click.
That premium is higher than the 57% figure reported in Shopify-derived analyses, which reflects a different basket mix and window. Treat 57% as a conservative floor and 82% as the upper end. For what the gap is worth in revenue terms once you weight it by traffic share, see our analysis of why Perplexity shoppers spend more than ChatGPT referrals.
The pattern extends down the tail: lower-volume engines tend to send higher-AOV shoppers, with Claude's small sample posting the dataset's highest per-order value at $295.
The quiet story is Copilot
It sent only 0.7% of the traffic, but converted at 2.56% — essentially on par with ChatGPT, and ahead of both Bing Ads (1.70%) and Google Ads (1.87%). Microsoft has put a small but commerce-ready referrer into the funnel that most brands do not measure separately.
What do AI-referred shoppers ask for?
They arrive pre-qualified and in comparison mode. When they engaged with the on-site assistant, 32.5% asked a comparison question ("which is better", "X versus Y"), against 28.6% of non-LLM shoppers.
The largest behavioural gap is category-specific intent. Among LLM-referred shoppers, 20.4% asked about a skin or body concern such as acne, dryness or anti-ageing, versus 11.5% of non-LLM shoppers — an 8.9-point difference and the widest topic delta in the dataset.
What they don't ask is as telling. LLM-referred shoppers were less likely to ask "where is my order" (1.1% versus 1.7%) or about returns (0.5% versus 1.2%). These are net-new prospects with pre-purchase questions, not customers with a service problem.
The implication is a design choice: if AI-referred shoppers want comparison and recommendation, greeting them with a support-ticket widget wastes the visit. The playbook for selling inside ChatGPT and Gemini starts with a product-discovery conversation, not a help desk.
Who is capturing LLM traffic today?
The channel is real but concentrated. Of the US brands in the dataset, just 10% received 1,000 or more LLM-referred visitors in the seven-month reliable window — and that group captured roughly 90% of LLM-referred value.
The other 90% captured little to none, either because their products do not yet surface in AI recommendations, or because their content is not structured for AI shopping research to read.
The brands that captured the channel share a profile. Four of the five top US brands by LLM volume sat in fashion, apparel, footwear, skincare, beauty, health and wellness, or home improvement. These are categories where the shopper's question is "is this right for me", not "is this in stock" — exactly what an AI engine answers well.
We do not name individual brands or publish per-brand traffic or revenue.
Methodology
We classify each visitor by their first on-site session in a month for a given brand, inferring the arrival channel from UTM parameters, click identifiers (gclid, fbclid, ttclid, msclkid), and the referring host. LLM traffic is sub-classified into providers using UTM tags and direct referrers, including chatgpt.com, perplexity.ai, claude.ai, gemini.google.com and copilot.microsoft.com, plus a long tail of Kagi, Brave, you.com, Meta AI and character.ai.
Checking both signals matters: in one 40-day platform-wide window, UTM-tagged ChatGPT visits outnumbered referrer-identified ones by roughly ten to one, so referrer-only counting would miss most of the channel.
Conversion uses a same-month attribution model: a visitor's first session in a month is joined to checkout events for the same anonymised fingerprint in that same month. This deliberately conservative rule undercounts true conversion, because a shopper who lands in October and buys in November is not credited to the channel. The undercount applies uniformly across all channels, so the relative comparisons in the conversion table are fair even though the absolute rates are understated.
For the full account of how we score and sample AI visibility, see our companion AI visibility methodology page and AI search revenue attribution writeup.
Limitations
Here is what the data cannot support.
- Conversion rates are understated. Roughly 25% of checkout events could not be matched to a visitor, and cross-month conversions are dropped entirely.
- The engagement lift is an association, not a controlled result. Shoppers self-select into engagement, so we do not claim the assistant caused the difference.
- Channel share can move as the engines change their own models and routing.
- Claude's AOV rests on 188 visitors. Directional only.
What holds up under every adjustment is the cohort-normalised 6.5x growth and the ordering of the conversion table.
The channel shift already happened
The debate about whether AI would change how people shop is over. The data settled it a year ago.
A channel that was a rounding error in May 2025 now converts better than the paid channels most brands spend the most on, and it is compounding. The open question is whether you can measure it — because you cannot optimise a channel you cannot see by provider, product and revenue.
That measurement problem is the one we built for. We can publish arrival-to-checkout numbers because visibility data, an on-site agent and purchase outcomes live in a single system, which is what lets Alhena AI Visibility trace AI answers to revenue rather than to mentions — down to the product level covered in our guide on SKU-level AI visibility.
The brands that start measuring now will be in the top 10%, not the bottom 90%.
See which engines send you shoppers
Alhena traces AI answers to revenue by provider, product and page — not to mentions.
Frequently asked questions
LLM-referred traffic to online stores grew 6.5x, a 550% increase, over the 12 months from May 2025 to April 2026, measured on a stable cohort of 30 US brands. Across the full 310-brand portfolio gross LLM growth was about 29x, but that figure includes new brands onboarding to tracking, so the cohort-normalised 6.5x is the more defensible number.
ChatGPT accounted for 96.1% of US LLM-referred traffic over the 12-month study window. Perplexity was a distant second at 2.6%, followed by Copilot at 0.7%, Gemini at 0.3%, other LLMs at 0.2% and Claude at 0.1%. Today the AI referral story for online stores is almost entirely a ChatGPT story.
Yes. In the US over the October 2025 to April 2026 window, LLM/AI traffic converted at 2.68%, ranking fourth of 13 tracked channels and beating Google Ads at 1.87% and Meta Ads at 0.51%, at no media cost. This rate is likely understated, because roughly 25% of checkouts could not be matched to a visitor and cross-month purchases were not counted.
Most analytics setups identify AI traffic by referring host alone. In one 40-day platform-wide window, UTM-tagged ChatGPT visits outnumbered referrer-identified ones by roughly ten to one, meaning referrer-only counting misses most of the channel. Check both signals before concluding the channel is small for your brand.
Claude posted the highest average order value at $295, though that rests on a sample of 188 visitors and should be read as directional, not statistical. Among higher-volume engines, Perplexity shoppers spent $129 per order versus ChatGPT's $71, an 82% gap. All order-value figures are US and cover the October 2025 to April 2026 window.
Different datasets, baskets and windows. The 57% figure comes from Shopify-derived analyses comparing Perplexity purchasers against other AI platforms; the 82% figure is our own measurement of $129 versus $71 across 310 brands from October 2025 to April 2026. Both point the same direction, so treat 57% as a conservative floor and 82% as the upper end.
This study uses a different brand cohort of about 310 brands and a longer 12-month window than our earlier State of AI Commerce report, and it uses a stable-cohort method to separate channel growth from new-brand onboarding. Because the populations, windows and definitions differ, the two should not be read as a like-for-like comparison.
Each visitor's arrival channel is inferred from UTM parameters, click identifiers and the referring host, with LLM providers sub-classified by referrers such as chatgpt.com and perplexity.ai. Conversion uses a conservative same-month model joining a visitor's first session to checkout events for the same anonymised fingerprint in that month, which undercounts true conversion uniformly across channels. Growth figures use a stable cohort of brands active in both endpoint months.
Only the top 10% of US brands in the dataset received 1,000 or more LLM-referred visitors in the seven-month reliable window, and that group captured roughly 90% of LLM-referred value. The brands winning today skew toward skincare, beauty and high-consideration apparel, where shoppers ask fit and comparison questions before buying. For the other 90% of brands, the channel is still largely untapped.