Brands that dominate Google organic rankings are invisible in 62% of AI-generated answers. As generative AI reshapes product discovery for online retailers, e-commerce brands, and direct-to-consumer e-commerce businesses. Worse, the competitors beating you in ai search engines like ChatGPT Shopping and Perplexity aren't always the same brands you're fighting on the SERP. A competitive e-commerce AEO and AI visibility audit exposes the use case of who is winning your category in AI search, why they're winning, and which fixes close the coverage gap fastest to optimize through targeted optimization. This post is the step-by-step guide and guide and playbook: how to discover your real AI competitors, reverse-engineer their wins query by query using seo and AI visibility data, score each gap, and run a two-week sprint cadence that turns findings into results influenced by real competitive data.
Your AI Competitors Aren't Your Google Competitors
This is the first step and the biggest surprise for most e-commerce growth teams running e-commerce stores. The brands LLMs surface in product discovery for product queries often differ sharply from those ranking on page one of Google Search through seo optimization.
Profound's research found that only 12% of URLs overlap between ChatGPT citations and Google's top organic results. For commercial queries like "best men's running shoes," the correlation is actually negative (r = -0.98). The brands ChatGPT prefers are often the opposite of what Google ranks.
Audit gaps often trace back to weak citations. Understand why in our post on why being cited in AI answers isn't enough.
So how do you find out who you're actually competing against?
Category-Level Prompt Testing to Discover Real AI Competitors
Build a discovery set of 10 to 15 category-level prompts and queries. These aren't branded prompts about your company. They're the topics and questions buyers ask before they know which brand to choose:
- "What are the best [product category] brands for [use case]?"
- "Top [product type] under $[price] in 2026"
- "Which [product category] has the best reviews?"
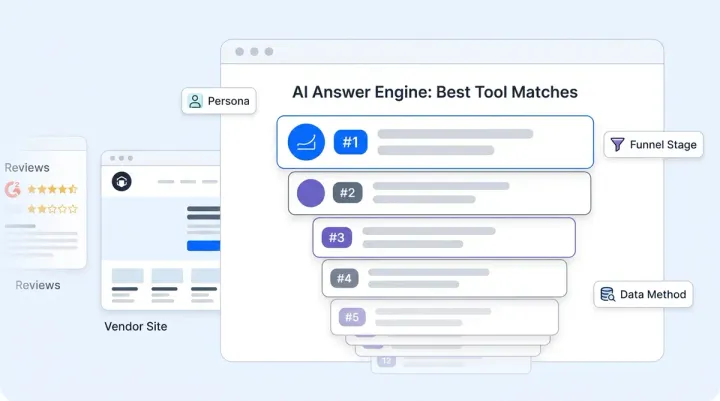
Run each prompt across four broad ai search engines: ChatGPT, Perplexity, Google AI Overviews, and Gemini. ChatGPT and Perplexity surface different brands than Gemini for the same prompt. Use fresh sessions with no conversation history. Record every brand mentioned, not just whether you appear. After 10 prompts across four platforms, you'll have a map of 40 AI responses. The brands that appear in 50% or more of those responses are your real AI competitors.
One DTC skincare brand we've seen discovered that its top AI competitor wasn't any of its three Google rivals. It was a retailer private-label line that dominated review roundups and had strong trust signals that LLMs interpreted as higher authority.
Reverse-Engineering Why Competitors Win AI Recommendations
Once you know who your AI competitors are, the next step is figuring out why each generative ai engine and ai agents prefer them. This requires testing 20 to 30 buying-intent queries across three tiers.
Building a Structured Query Library
Organize your prompts and queries by buying intent:
- Discovery (10 queries): "Best [category] for [use case]" and "Top [product type] brands 2026"
- Comparison (10 queries): "Compare [Competitor A] vs [Competitor B] for [feature]" and "[Your brand] or [Competitor] for [need]?"
- Purchase (10 queries): "[Item] under $X with [feature]" and "Where to buy [specific item] right now"
Run each prompt three times per platform (ChatGPT, Perplexity, Google AI Overviews, Gemini) to account for response volatility and broad inconsistency. AirOps found that only 20% of brands remain present across five consecutive runs of the same query, so single-run testing gives misleading data.
Documenting Who Appears and in What Position
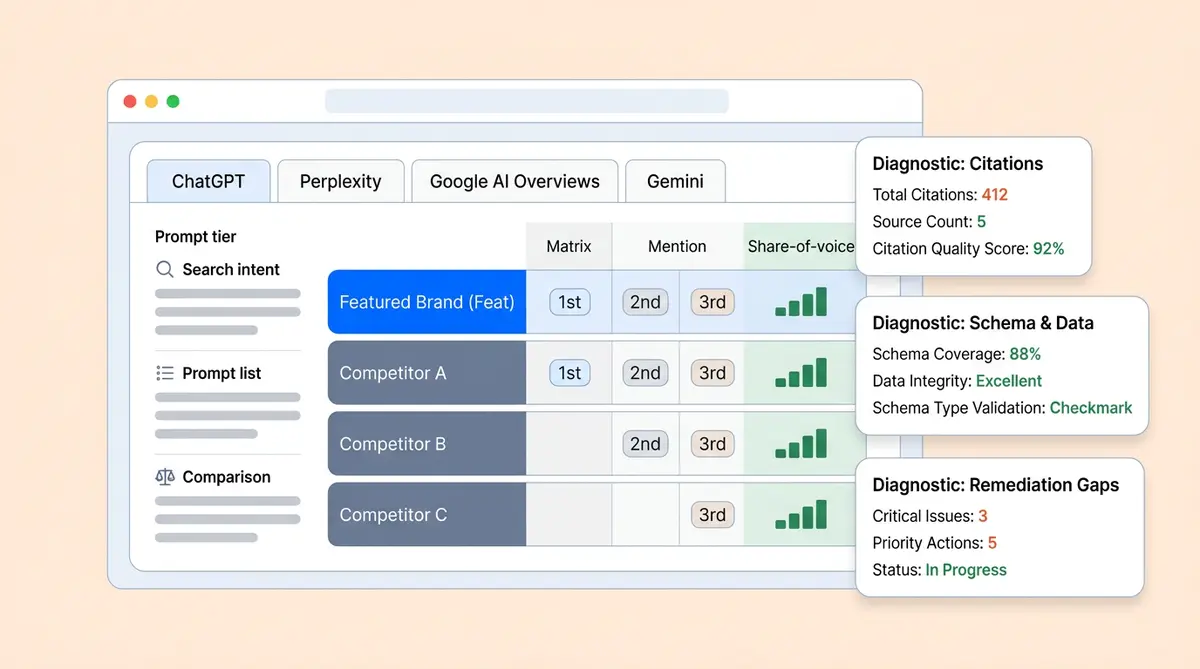
For each response, capture and analyze five data points:
- Brand mentioned: Which brands appear in the answer?
- Position: First recommendation, second, third, or mentioned in passing?
- Citation source: What URL did the AI cite? Your website, a review site, Reddit, a listicle?
- Item specificity: Did the AI name a specific SKU, or just the brand?
- Sentiment: Was the mention positive, neutral, or a caveat ("good but expensive")? Sentiment analysis across responses reveals whether LLMs frame you positively or with qualifications.
Use Semrush for seo keyword gaps, Semrush for brand monitoring, Ahrefs for backlink data, Otterly for AI search engine monitoring and seo platforms like Semrush, or similar seo platforms, monitoring tools, and optimization dashboards to supplement this data. Score each mention: 3 points for a first-position recommendation, 2 for second, 1 for third, 0.5 for a passing mention. Total these across all queries and platforms to calculate each brand's AI share of voice.
The Competitive Scoring Rubric: Diagnosing Why You Lose Each Query
The data tells you where you lose. The scoring rubric tells you why. For each query where a competitor appears and you don't, score both your page and the competitor's across five dimensions. This isn't about learning what schema types to use (our schema for AI search guide covers that). It's about comparing your execution against the specific competitor that beat you.
How to Score: Side-by-Side Competitor Comparison
For each lost query, open your page and the competitor's cited page side by side. Score each on a 1 to 5 scale:
- Data completeness (1-5): Count the structured data fields on each page. Does the competitor expose GTIN, pricing, availability, shipping, and return policies in machine-readable format while you expose only three of those? Score the delta.
- Third-party citation count (1-5): Search for each brand on Google with queries like "[brand] + [category] + review" and "[brand] + best + [category]." Count how many external publications, listicles, and Reddit threads mention each brand. If the competitor has 12 and you have 2, that's a 5-1 gap.
- Content specificity (1-5): Does the competitor's page answer the exact query with specific data ("42mm case, 50m water resistance, $349") while yours uses generic marketing language ("premium quality, great value")? LLMs pull from pages that directly answer the question asked.
- Price signal strength (1-5): Is pricing exposed in the competitor's structured data, including currency code and availability? Or is it buried behind an "add to cart" button? AI agents interpret visible pricing as a trust signal for purchase-intent queries.
- Freshness recency (1-5): Check the last-modified date in the page header or sitemap. Score the gap between your page's update date and the competitor's. A 3-month-old page versus your 11-month-old page is a 2-point freshness disadvantage.
Total the scores. A competitor scoring 22/25 while you score 14/25 gives you a clear, quantified gap for that query. Group your lost queries by which dimension has the widest delta. That's your priority fix category.
Pattern Recognition Across Lost Queries
After scoring 15 to 20 lost prompts, patterns emerge. Maybe 80% of your losses trace back to weaker third-party presence or thin product descriptions. Maybe your pricing signals are consistently 2 points behind competitors. Maybe your content strategy needs a complete rethink. Maybe your freshness scores are uniformly low because your catalog pages haven't been updated since last season.
The pattern tells you whether to invest in an earned media push, a content strategy overhaul, a technical sprint on your data feeds, or a content refresh cycle. Without the pattern, you're guessing.
Prioritizing Which Categories to Fight For
Not every lost query is worth reclaiming. Your audit shows dozens of queries where competitors beat you, but chasing all of them at once wastes resources. Here's how smart e-commerce brands and growth teams prioritize.
Focus on High-Margin Hero SKUs First
Start with the 10 to 20 SKUs that drive the most revenue and have the highest margins. Run the full query set specifically for these items. If your hero SKUs are invisible in AI recommendations and LLM product recommendations, that's the highest-ROI fix, because each captured recommendation delivers the most revenue per conversion.
Target "Close to Appearing" Queries
Some prompts will show you mentioned in passing or appearing on one platform but not others. These are your quick wins. You're already in the LLM's consideration set for these queries, and small improvements can push you into the first-position recommendation. Cross-reference these with your scoring rubric to find the specific fix needed.
Deprioritize Commodity Categories
If a massive marketplace or broad retailers dominate AI recommendations for a commodity category, and your brand has no differentiated angle, competing on that query isn't realistic. Focus on categories where your offering genuinely solves a specific use case better than the alternatives, because AI models are influenced by specificity and depth.
Building a Monthly Brand Monitoring and Competitive Visibility Report
A one-time audit gives you a snapshot. Monthly brand monitoring dashboards show whether your seo and optimization fixes are working and which ai search engines still rank competitors above you and whether competitors are pulling ahead. Here are the five metrics to track, along with how to present them to leadership.
The 5 Competitive Benchmarking Metrics
- AI Share of Voice by Category (You vs. Top 3): Track your brand's share versus each named competitor, month over month. A rising SOV against Competitor A while falling against Competitor C tells a different story than aggregate SOV. (See our AI share of voice guide for measurement methodology.)
- Citation Source Gap: Which third-party publications influenced AI to cite your competitors but not you? Track the number of unique citation sources per competitor versus your own. If Competitor B gained 5 new listicle mentions last month and you gained 0, flag it.
- Pricing Accuracy Delta: Compare the price LLMs display for your items versus your actual current price. Any mismatch means stale data feeds are hurting your competitive position. Track at the SKU level.
- Scoring Rubric Trend: Re-score your top 10 lost queries monthly using the five-dimension rubric above. Are your scores closing the gap, or is the competitor pulling further ahead?
- Position Shift Map: For your priority queries, track whether you moved up, down, or stayed flat relative to each named competitor. A shift from third to first on a high-intent query is worth more than appearing for 10 new low-intent queries.
Presenting to Leadership
Skip the raw data. Leadership needs three monitoring dashboard slides: these dashboards: (1) a category-level heatmap showing where you lead vs. where each named competitor leads, (2) a trend line showing your AI share of voice versus competitors over 3 to 6 months, and (3) a prioritized list of the top 5 actions ranked by estimated revenue impact. Tie every recommendation to your average conversion rate and AOV from AI-referred traffic.
The Action Loop: From Audit Findings to Fixes in Two Weeks
Auditing without action is just expensive research. The goal is a repeatable two-week sprint cadence that turns each finding into a content optimization or deployed fix.
Week 1: Diagnose and Prioritize
- Days 1 to 2: Run the monthly query set (30 queries x 4 platforms x 3 runs = 360 data points). Score results.
- Days 3 to 4: For each query where you lost position or a competitor gained, run the scoring rubric. Categorize each finding by dimension.
- Day 5: Build a plan around revenue impact. Bring your content, SEO, GEO, and catalog data teams together. Assign owners for each fix.
Week 2: Execute and Verify
- Days 6 to 8: Deploy the optimization fixes. Data team handles structured data and pricing feeds. Content team refreshes stale pages and publishes comparison content targeting gap queries. PR/earned media team pitches to publications where competitors are cited and you're not.
- Days 9 to 10: Re-run priority queries to verify whether fixes influenced the needle. Document what worked and what didn't. Set up ongoing monitoring for your priority queries using AI visibility monitoring tools. Feed learnings into the next sprint and adjust your monitoring cadence.
Over three to four months of this cadence, patterns emerge about which fix types deliver the fastest gains for your catalog. Most teams find that data completeness and content freshness deliver the quickest wins, while earned media coverage and review coverage takes longer but produces the most durable competitive advantage.
How Alhena AI Visibility Automates the Competitive Audit
Running this playbook manually works for the first audit, but monitoring 360 data points per month across ai search engines at 15 to 20 hours of analyst time doesn't scale. For any ecommerce business building an ongoing AI search, AEO, and seo strategy, automation is the realistic path forward. Tools like Semrush handle traditional seo keyword analysis, but they lack AI search engine visibility tracking. Traditional seo tools like Semrush and Ahrefs only measure Google rankings.
An audit is only as good as the tools behind it. See which tracking platforms we recommend in our roundup of the best AI brand visibility tracking tools.
Need a broader tool comparison beyond auditing? We tested 12 platforms in our guide to the best AI visibility tools for ecommerce.
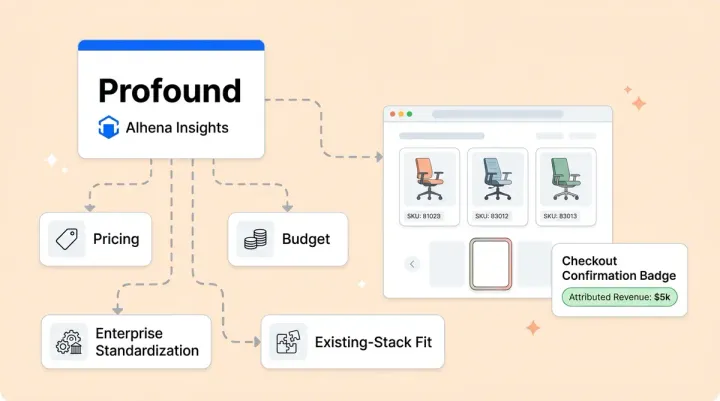
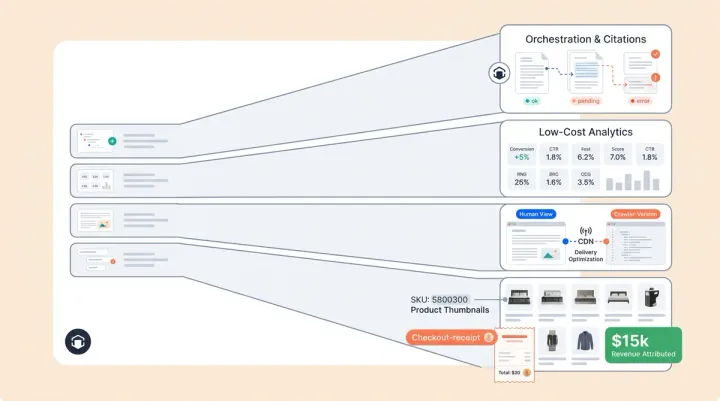
Alhena AI Visibility automates competitive monitoring and product discovery tracking at the SKU level. It shows which competitor items outrank yours for specific queries, where pricing mismatches exist between your data feeds and what LLMs display, and which citation sources your ecommerce brandr competitors have that you're missing.
Alhena's AI Shopping Assistant ingests your full catalog and creates a clean, verified data layer with complete product descriptions that ai agents, search engines, and generative ai models can parse. That data flows to external AI platforms, closing the completeness and accuracy gaps that the scoring rubric exposes. Manawa saw their response time drop from 40 minutes to 1 minute with 80% inquiry automation, freeing teams to focus on strategic AI visibility work instead of reactive customer support.
If your audit relies on scraped data, the results may mislead you. Read why in our post on AI visibility intelligence and first-party data.
Closing audit gaps requires the right infrastructure. Map yours with our guide to the AI visibility tech stack for ecommerce.
The platform connects to Shopify, WooCommerce, Magento, and Salesforce Commerce Cloud. Shopify retailers, pulling live catalog data, delivery estimates, and pricing, then syncing it for both traditional and agentic commerce. Fixes deploy once and propagate everywhere.
Key Takeaways
- Your AI competitors often differ from your Google organic competitors. Category-level query testing across ChatGPT, Perplexity, Google AI Overviews, and Gemini reveals who you're really competing against.
- Test 20 to 30 buying-intent queries across four platforms, three times each, to account for LLM response volatility. Score each mention by position to calculate competitive AI share of voice score.
- Use the five-dimension scoring rubric (data completeness, third-party citations, content specificity, price signal strength, freshness) to quantify the exact gap for each lost query.
- Prioritize high-margin hero SKUs and "close to appearing" queries where small fixes deliver outsized results.
- Track five competitive benchmarking metrics monthly: SOV by competitor, citation source gap, pricing accuracy delta, rubric trend, and position shift map.
- Run a two-week sprint cadence to turn audit findings into deployed fixes with measurable verification.
Ready to see which competitors are beating your SKUs in AI search, and exactly why? Book a demo with Alhena AI to get automated competitive intelligence, AI-powered optimization, and visibility audit reports, or start free with 25 conversations. No credit card required.
Alhena AI
Frequently Asked Questions
How do I find out which brands are my real competitors in AI search?
Run 10 to 15 category-level discovery queries across ChatGPT Shopping, Perplexity, Google AI Overviews, and Gemini using fresh sessions. Record every brand mentioned across all responses. The brands appearing in 50% or more of AI answers are your real AI competitors. Only 12% of URLs overlap between ChatGPT and Google, so your AI competitors are often completely different from your organic search rivals.
How many prompts should I test in a competitive AEO and AI visibility audit?
Test 20 to 30 buying-intent queries organized across three tiers: discovery, comparison, and purchase. Run each query three times per platform (ChatGPT, Perplexity, Google AI Overviews, Gemini) to account for response volatility. This produces 240 to 360 data points per audit cycle, enough to identify reliable patterns in which competitors win and why.
What scoring system should I use to compare my AI visibility against competitors?
Use a five-dimension scoring rubric: data completeness (1-5), third-party citation count (1-5), content specificity (1-5), price signal strength (1-5), and freshness recency (1-5). Score both your page and the competitor's cited page side by side for each lost query. Total the scores to quantify the exact gap, then group lost queries by which dimension has the widest delta to identify your priority fix category.
How do I decide which competitor to audit first?
Start with the competitor that appears most frequently in AI answers for your highest-margin product categories. Run the full query set against that competitor first. If one competitor dominates discovery queries while another wins comparison queries, audit them separately because the reasons they win and the fixes needed will differ.
What is a citation source gap and why does it matter for competitive AI visibility?
A citation source gap measures how many unique third-party publications (review sites, listicles, Reddit threads, niche blogs) mention your competitor versus you. About 85% of AI brand citations come from external sources, not brand-owned pages. If Competitor B has 15 unique citation sources and you have 3, closing that gap through earned media and review outreach directly improves your AI recommendation rate.
How often should I repeat a competitive AI visibility audit audit?
Run a full 30-query competitive audit monthly, with weekly spot checks on your five highest-priority queries. AI answers are volatile, so monthly tracking catches competitor gains before they become entrenched. Use the two-week sprint cadence: week one for diagnosis and prioritization, week two for deploying fixes and verifying results.
What is the two-week sprint cadence for closing AI visibility gaps?
Days 1-2: run the monthly prompt set and score results. Days 3-4: run the five-dimension scoring rubric on lost prompts. Day 5: prioritize fixes by revenue impact and assign owners. Days 6-8: deploy data, content optimization, product descriptions, and earned media fixes to optimize pages and improve rankings. Days 9-10: re-run priority queries to verify whether fixes moved the needle, then feed learnings into the next sprint.
Can I automate competitive AI visibility tracking with tools like Otterly or Alhena instead of running manual queries?
Yes. Alhena AI Visibility automates competitive tracking at the SKU level, showing which competitor items outrank yours for specific queries across ai search engines, where pricing mismatches exist, and which citation sources you're missing. It connects to Shopify, WooCommerce, Magento, and Salesforce Commerce Cloud to pull live catalog data and track AI visibility changes continuously, turning brand monitoring tools into a live dashboard.
How do I present competitive AI visibility findings to my leadership team?
Prepare three slides: (1) a category-level heatmap showing where you lead versus where each named competitor leads across AI platforms, (2) an AI share of voice trend line showing your SOV versus each competitor over 3 to 6 months, and (3) a prioritized list of the top 5 actions ranked by estimated revenue impact, tied to your conversion rate and AOV from AI-referred traffic.
What is the difference between brand-level and SKU-level competitive AI auditing?
Brand-level auditing tracks whether AI mentions your brand name at all. SKU-level auditing tracks whether AI recommends your specific items for specific queries. A brand can have 60% overall AI share of voice but be invisible for its highest-margin SKUs. SKU-level auditing, which Alhena AI Visibility automates, identifies these hidden competitive gaps that brand-level monitoring misses entirely.