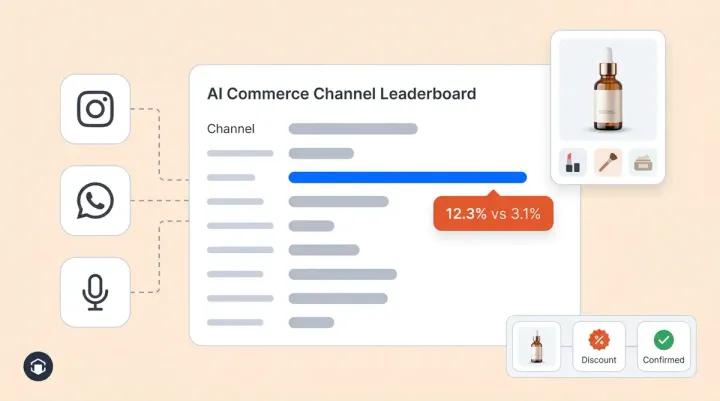
The Vertical Conversion Rankings: AI Commerce Performance Is Not Equal
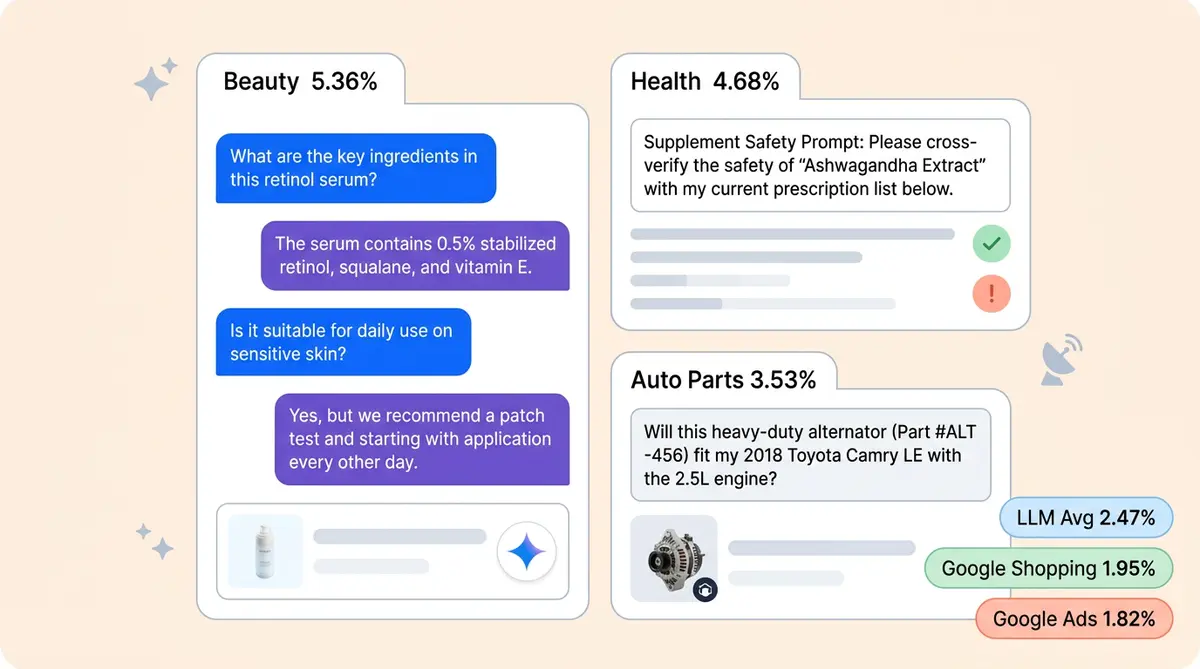
Beauty and Skincare leads at 5.36%. Health and Supplements follows at 4.68%. Motorcycle and Auto Parts converts at 3.53%. These are real LLM traffic conversion rates across ecommerce verticals, and they tell a clear story: AI commerce vertical conversion performance depends entirely on how shoppers in each category research and buy.
The cross-vertical average for LLM-referred traffic sits at 2.47%, already outperforming Google Shopping at 1.95% and Google Ads at 1.82%. But that average hides a 2x spread between the top and middle of the pack. The verticals winning in AI commerce share one trait: their shoppers arrive with specific, answerable questions that align with how AI platforms deliver recommendations.
This breakdown covers what drives LLM traffic by industry, where each vertical has room to grow, and what category-specific optimization looks like in practice.
Beauty and Skincare: 5.36% Conversion, the Clear Leader in AI Commerce
Beauty shoppers ask ingredient questions, skin-type queries, and routine-building requests. "Is niacinamide good for oily skin?" "What order should I layer serums?" These are exactly the kinds of natural-language questions that AI platforms answer well, and they map directly to purchase decisions.
The 5.36% LLM conversion rate is more than double the cross-vertical average. McKinsey estimates generative AI could create $9 to $10 billion in additional value for the beauty sector alone. One luxury skincare brand deployed an AI beauty advisor that builds personalized routines based on skin type and ingredient preferences, resulting in 3x conversion rates, 38% AOV uplift, and 11.4% of total site revenue from AI conversations.
The underlying behavior is consultative. Beauty shoppers want the same expertise they'd get from an in-store associate, and AI scales that interaction across thousands of simultaneous sessions. Brands in this vertical should prioritize structured ingredient data, skin concern taxonomies, and routine-pairing logic in their product data feeds to maximize AI commerce vertical conversion.
Where to grow: Most beauty brands still treat AI as a support channel. The gap between current engagement rates (typically 1 to 2% of visitors) and best-in-class deployments (5 to 6%) represents significant untapped revenue. Brands that train AI agents on ingredient interactions, routine sequencing, and shade matching will close that gap fastest.
Health and Supplements: 4.68% Conversion Driven by Research Behavior
Health and supplement shoppers don't browse casually. They research. They want to validate claims, check ingredient safety, and understand efficacy before purchasing. Over 70% of wellness consumers prefer brands that list ingredients and origins clearly, and 84% rate wellness as a top life priority when evaluating brands.
This research intensity is why the vertical converts at 4.68% from LLM traffic. When a shopper asks "Does ashwagandha interact with blood pressure medication?" or "What's the best magnesium form for sleep?", they're expressing high purchase intent wrapped in a safety question. AI that answers accurately, while staying within structure/function claim boundaries, converts these researchers into buyers.
AI-driven recommendations increase AOV by 15 to 22% in health and wellness, partly because guided shopping surfaces complementary products (a probiotic paired with a prebiotic, for example) that shoppers wouldn't find through standard navigation.
Where to grow: Compliance is the key differentiator. The FTC has filed over 120 cases against supplement companies for misleading health claims. Health brands need AI agents with built-in guardrails that permit structure/function claims while routing medical questions to human agents. Brands that solve this compliance challenge will see their AI commerce vertical conversion climb well above 4.68%.
Motorcycle and Auto Parts: 3.53% Conversion on Compatibility Queries
Auto parts shoppers need one thing above all else: confirmation that the part fits their vehicle. Inaccurate fitment causes 86% of auto parts returns, and return rates in the category run as high as 20%. This creates a perfect use case for AI.
The 3.53% LLM conversion rate reflects shoppers asking specification-driven questions: "Brake pads for a 2018 Honda Civic." "Oil filter compatible with a 2020 Ford F-150." These are binary, data-intensive queries that AI answers definitively when connected to proper fitment databases. AI replaces the cumbersome Year/Make/Model dropdown menus with natural language processing that feels faster and more accurate.
AI-driven fitment tools reduce returns by 20 to 30%, and AI cross-selling increases auto parts AOV by 15 to 25%. One major auto parts platform reduced incorrect part returns by 24% after deploying AI-driven fitment validation. Currently, 41% of leading auto parts platforms use AI-based part identification.
Where to grow: The biggest opportunity is connecting AI agents to VIN-level data, OEM specifications, and aftermarket compatibility databases in real time. Brands that feed vertical-specific fitment intelligence into their AI shopping experience will convert more visitors and dramatically cut return costs.
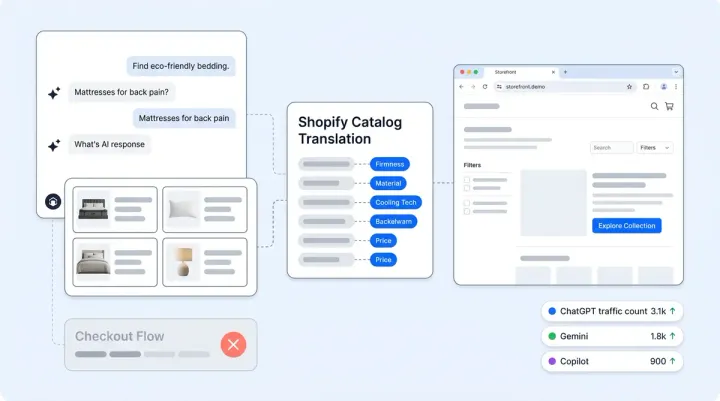
Home and Lifestyle: 2.86% Conversion Through Comparison Queries
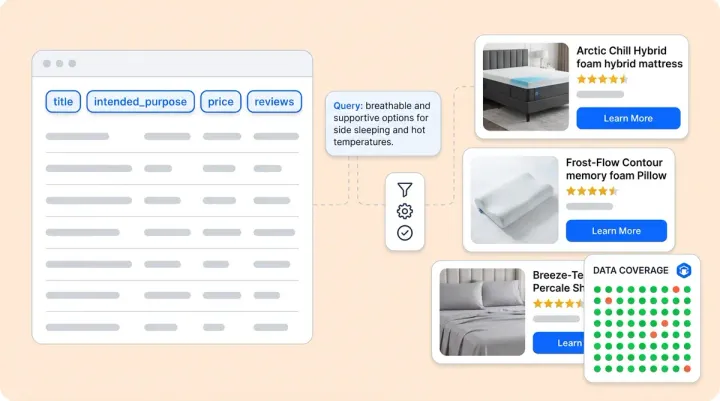
Home and lifestyle shoppers engage through comparison and use-case questions. "Is this sofa good for a small apartment?" "Which countertop material works best with kids?" These queries drive solid AI engagement, but the visual and spatial nature of home shopping means AI conversion lags behind the research-heavy verticals.
At 2.86%, the vertical still outperforms baseline home furnishing conversion rates of 0.5 to 1.8%. Puffy achieved 63% automated inquiry resolution with 90% CSAT using AI for mattress shopping, proving that the right implementation moves the needle even in high-consideration home categories.
Where to grow: Home brands should focus on room-context data, dimension specifications, and material comparison content. AI agents that can answer "Will this 84-inch sofa fit through a 30-inch doorway?" with confidence will outperform those limited to generic product descriptions. Structured use-case data (pet-friendly, kid-safe, small-space optimized) gives AI the context it needs to drive higher conversion rates.
Fashion and Apparel: 2.40% Conversion With a Visual Gap
Fashion converts at 2.40% from LLM traffic, lower than the cross-vertical average. The reason is straightforward: fashion shopping is more visual and price-driven than query-driven. Shoppers discover outfits through images, social feeds, and browsing, not through the text-based questions that AI handles best.
That said, AI visual search drives a 26% average conversion increase in fashion when deployed, and visually similar product recommendations produce 6.3x higher conversion rates. The opportunity isn't in replacing visual discovery with text-based AI. It's in layering AI onto the visual experience: style matching, size recommendation, and out-of-stock recovery through similar alternatives.
Where to grow: Fashion brands should invest in multimodal AI capabilities that combine image recognition with preference learning. AI-powered sizing alone could cut the 30%+ return rate that drags down the category. Brands that connect style profiles, body measurements, and visual preference data to their AI shopping assistant will push well beyond the 2.40% baseline.
Electronics and Luxury: Longer Cycles, Growing AI Influence
Electronics and luxury sit at the lower end of AI commerce vertical conversion, not because the shoppers ignore AI, but because high price points create longer consideration cycles. Adobe data shows electronics among the top AI shopping categories by traffic volume, and 86% of AI shopping sessions happen on desktop, signaling deliberate research behavior that aligns with how consumers shop for high-ticket items.
Luxury brands face a similar dynamic. Victoria Beckham saw a 20% AOV increase from AI-guided shopping, showing that even in premium categories, AI shifts the revenue curve. The payoff per conversion is high enough that small percentage-point improvements generate outsized revenue impact.
Where to grow: Both categories need AI that supports multi-session journeys. Spec comparison tools for electronics, provenance and craftsmanship storytelling for luxury, and persistent memory that picks up where the last conversation left off. The 1% of visitors who engage with AI account for roughly 10% of total revenue, and in high-AOV categories, that ratio is even more pronounced.
Vertical-Specific Optimization: What Each Category Should Prioritize
AI commerce vertical conversion performance follows a pattern. The more specific and answerable the shopper's pre-purchase questions, the higher the conversion rate. Here's what each category should prioritize to close the gap between current performance and potential:
- Beauty: Structured ingredient databases, skin concern taxonomies, routine-building logic, shade matching data
- Health: Efficacy content with compliance guardrails, ingredient interaction databases, structure/function claim frameworks
- Auto Parts: VIN-level fitment data, OEM cross-reference databases, real-time compatibility validation
- Home: Dimension and spatial data, use-case tagging (pet-friendly, small-space), material comparison content
- Fashion: Visual search capabilities, AI-powered sizing, style profile matching, out-of-stock alternatives
- Electronics: Spec comparison frameworks, multi-session memory, use-case recommendation engines
- Luxury: Provenance storytelling, craftsmanship detail, concierge-level conversational depth
Alhena AI gives brands the vertical-specific intelligence to act on these insights. With category benchmarks, engagement optimization, and conversion data built from how real shoppers in each vertical interact with AI before buying, brands can see exactly where they stand relative to their category's best performers and where to focus next.
The Brands Winning AI Commerce Are Playing a Vertical Game
The data is clear: AI commerce performance is not uniform across industries. Beauty at 5.36%, Health at 4.68%, Auto Parts at 3.53%, Home at 2.86%, Fashion at 2.40%, and Electronics and Luxury at the early stages of a longer curve. The verticals winning are the ones where brands have aligned their product data, content strategy, and AI engagement approach with how their specific shoppers research and buy.
Brands applying a generic AI strategy across all categories are underperforming their vertical's true potential. The gap between average AI conversion and best-in-class deployment is 3 to 4x in most verticals. Closing that gap starts with understanding your category's shopper behavior and building your AI experience around it.
Ready to see how your vertical performs? Book a demo with Alhena AI to get category-specific benchmarks and optimization recommendations, or start free with 25 conversations to test it with your own product catalog.
Frequently Asked Questions
Which ecommerce vertical has the highest AI commerce conversion rate?
Beauty and Skincare leads all verticals at 5.36% LLM traffic conversion. Shoppers in this category ask ingredient, routine, and skin-type questions that align perfectly with how AI delivers recommendations. Alhena AI helps beauty brands capitalize on this behavior with structured product data and AI-guided shopping experiences tuned to consultative purchase journeys.
How does AI commerce vertical conversion differ between health supplements and auto parts?
Health and Supplements converts at 4.68% from LLM traffic, driven by efficacy research and safety validation queries. Auto Parts converts at 3.53%, driven by fitment and compatibility lookups. Alhena AI supports both verticals with category-specific AI agents that match each vertical's dominant shopping behavior, from compliance-safe health guidance to VIN-level fitment validation.
Why does fashion have a lower AI commerce conversion rate than beauty or health?
Fashion converts at 2.40% from LLM traffic because shopping behavior in this vertical is more visual and price-driven than query-driven. Text-based AI handles ingredient or fitment questions better than style discovery. Alhena AI bridges this gap by combining visual search, style matching, and AI-powered sizing recommendations that align with how fashion shoppers actually browse and buy.
How can ecommerce brands benchmark their AI conversion rate against their specific vertical?
Brands need vertical-specific benchmarks, not cross-industry averages. Beauty benchmarks at 5.36%, Health at 4.68%, Auto Parts at 3.53%, Home at 2.86%, and Fashion at 2.40% for LLM traffic conversion. Alhena AI provides category-level performance data so brands can see exactly where they stand relative to their vertical's best performers and identify optimization opportunities.
What product data should brands prioritize to improve AI shopping conversion in their vertical?
Each vertical requires different data. Beauty brands need ingredient databases and skin concern taxonomies. Health brands need compliance-safe efficacy content. Auto parts brands need VIN-level fitment data. Home brands need dimension and use-case tagging. Alhena AI helps brands structure their product data for each vertical's AI shopping patterns, increasing visibility and conversion across LLM-driven shopping surfaces.