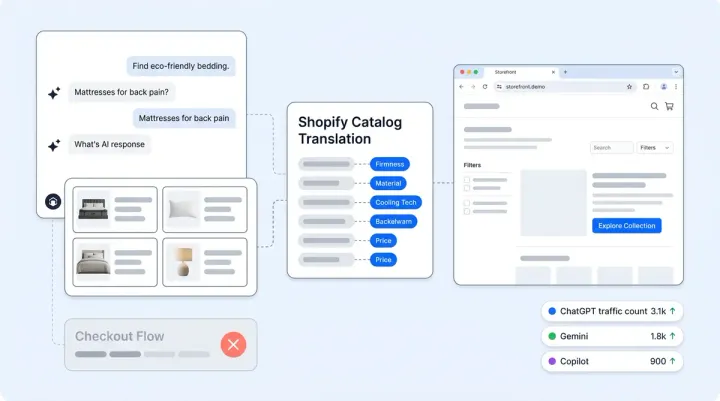
Across 329 e-commerce brands in the US and EU, AI now touches 1% of total e-commerce site visitors and drives roughly 10% of total sales. That ratio, 10x the sales impact relative to reach, is the defining metric of AI-assisted e-commerce in 2026. This article breaks down six findings from a multi-quarter survey of from Alhena AI's aggregated platform data across 9 traffic channels and 8 e-commerce product verticals that explain how that 10x multiplier works, where it's strongest, and what separates organizations capturing it from those that aren't.
Finding 1: LLM Traffic Is Now a Top-Four Commerce Channel
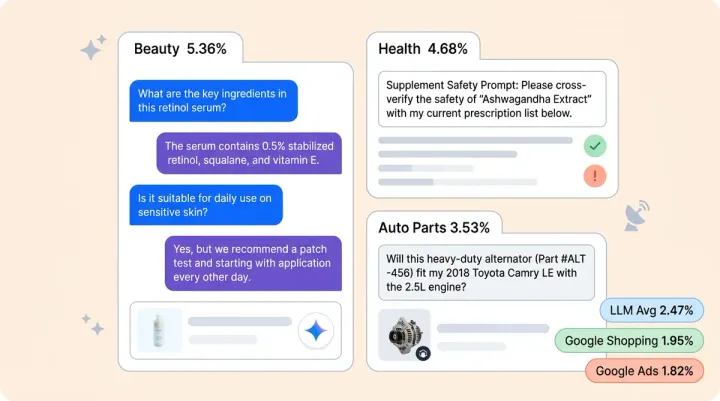
Traffic referred by large language models converts at 2.47%, placing it fourth among all measured e-commerce acquisition channels. The full ranking: SMS at 5.49%, affiliate at 3.12%, email at 2.92%, LLM at 2.47%, Google Shopping at 1.95%, paid search at 1.82%, direct at 0.73%, paid social at 0.52%, and short-form video ads at 0.09%.
LLM-referred traffic is growing at 40% quarter over quarter, and every visit arrives at zero ad spend. No cost-per-click, no bid management, no creative fatigue. A channel converting at 2.47% with no media cost and accelerating volume deserves a dedicated line in your e-commerce acquisition strategy, not a footnote.
Channel Conversion Ranking · 329 Brands · Q4 2024 to Q1 2026
Source: Alhena AI Agentic Commerce Report, 329 brands, US + EU · LLM highlighted at rank 4, zero ad spend
The economics get more interesting inside the channel. A single dominant AI platform accounts for 97% of all LLM referral traffic. The secondary platform, while far smaller in volume, drives 57% higher average order value. That AOV and value gap signals an audience composition and value difference worth monitoring. The primary platform sends consumers at scale: high-volume, mid-intent shoppers. The secondary sends fewer visitors, but those visitors arrive with deeper research context and higher consumer purchase intent per session.
LLM Platform Traffic Share and AOV Comparison
Source: Alhena AI, 329 brands · Platform split reflects audience composition, not quality
For a full breakdown of how LLM traffic stacks up across every acquisition channel, see Alhena's 329-brand LLM traffic conversion analysis.
Finding 2: AI Lifts Every Channel, but the Multiplier Is Not Flat
When visitors from any channel engage with Alhena AI on-site, conversion rates jump between 3x and 76x compared to visitors who skip the AI assistant. The effect holds across every measured traffic source. But the multiplier depends entirely on the channel's baseline conversion rate.
Short-form video ad traffic converts at 0.09% without AI. With AI engagement, that rate climbs toward 7%, producing a 76x multiplier. Paid social sits around 0.9% baseline, yielding a 13.1x lift. Paid search hovers near 2%, delivering a 6.1x lift. The pattern is consistent: channels with the widest information gap between the visitor's arrival context and purchase confidence see the highest AI multiplier.
AI Engagement Lift by Channel
Baseline conversion vs. AI-assisted conversion · Lower baseline = higher multiplier
| Channel | Baseline CVR | AI-Assisted CVR | Multiplier |
|---|---|---|---|
| Short-Form Video Ads | 0.09% | ~7% | 76x |
| Paid Social | 0.9% | ~12% | 13.1x |
| Paid Search | 2.0% | ~12% | 6.1x |
| LLM Referral | 2.47% | 9.84% | 4.0x |
| 2.92% | ~12% | 4.1x | |
| SMS | 5.49% | ~12% | 2.2x |
Source: Alhena AI, 329 brands · AI-assisted CVR converges near 12% regardless of channel
A short-form video viewer saw a 15-second clip. They're curious but know nothing about sizing, ingredients, or compatibility. A search visitor typed a specific product query and read three reviews. The information gap is small. AI closes information gaps through personalization and conversation. The wider the gap, the more conversion value AI delivers, and the larger the conversion lift.
This creates a direct implication for paid media strategy. Your highest-spend, lowest-converting traffic (social ads) offers the largest AI uplift opportunity. Organizations increasingly spending heavily on social acquisition without an on-site AI engagement layer are leaving the biggest conversion gains untouched. For e-commerce teams seeking the full channel-by-channel deployment and implementation strategy, see Alhena's analysis of AI conversion lift across paid channels.
Finding 3: AI Closes Sales, Not Just Discovery
The sharpest proof that AI drives revenue, not just engagement, sits in the cart-to-checkout data. Shoppers who interact with Alhena AI complete checkout at 49.3%. Shoppers who don't interact complete at 26.3%. That's nearly 2x the checkout completion rate, measured at the most critical conversion point in the funnel.
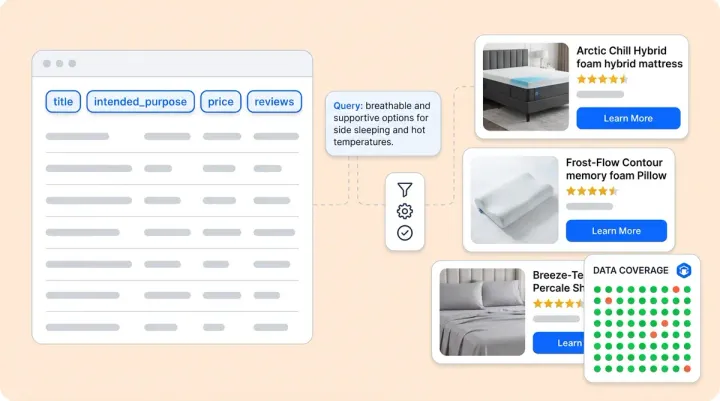
This metric matters more than top-of-funnel conversion rate because it isolates the purchase decision. A visitor who adds to cart has already expressed intent. The question is whether they follow through. AI's role at this stage is answering last-mile objections (sizing, shipping, return policy, product compatibility) fast enough that the shopper doesn't abandon. Alhena AI's agentic commerce checkout takes it further: populating carts, applying discount codes, and pre-filling checkout fields directly from the conversation, removing friction that static page experiences can't eliminate.
Read the full breakdown of how AI closes the cart-to-checkout gap across 329 brands.
Finding 4: Vertical Rankings Follow Research Intensity
AI e-commerce performance varies by category, and the pattern maps directly to how shoppers in each vertical research before buying.
Beauty and Skincare leads at 5.36%. Shoppers ask ingredient questions, skin-type queries, and routine-building requests. These are exactly the kinds of natural-language questions AI handles well. One luxury skincare brand on Alhena achieved 3x conversion rates, 38% AOV uplift, and 11.4% of total site revenue from AI.
Health and Supplements follows at 4.68%. Over 70% of wellness consumers prefer brands that list ingredients and origins clearly. Research-intensive shoppers who ask "Does ashwagandha interact with blood pressure medication?" are expressing high purchase intent wrapped in a safety question. AI that answers accurately converts these researchers into buyers. AI-driven recommendations increase AOV by 15 to 22% in health and wellness.
Auto Parts converts at 3.53% on compatibility queries. Inaccurate fitment causes 86% of auto parts e-commerce returns. AI replaces cumbersome Year/Make/Model dropdowns with natural language that confirms part compatibility in seconds.
Home and Lifestyle sits at 2.86%, driven by comparison and use-case questions. One home brand achieved 63% automated inquiry resolution with 90% CSAT through AI-guided product recommendations and matching.
Fashion converts at 2.40%, held back by the visual nature of apparel e-commerce. But AI sizing assistants cut the 30%+ return rate that erodes fashion e-commerce margins. One luxury fashion brand saw a 20% AOV increase after deploying AI product recommendations.
Electronics and Luxury sit at the lower end by conversion rate, but deliver the highest revenue per AI-assisted session because of their high price points. AI's role here is compressing long consideration cycles through spec comparison, multi-session memory, personalization, and concierge-level conversational depth.
AI Commerce Performance by Vertical
LLM conversion rate · Research intensity correlates with AI conversion
Source: Alhena AI, 329 brands · Labels indicate dominant shopper behavior driving AI conversion
The common thread: the more specific and answerable the shopper's pre-purchase questions, the higher the AI conversion rate. Verticals with consultative buying behavior (beauty, health, auto parts) outperform those driven by visual discovery (fashion) or extended deliberation (electronics, luxury). For vertical-specific optimization strategies, see Alhena's AI commerce performance breakdown by vertical.
Finding 5: US Converts at 3.50%, EU at 0.41%, and the Gap Is Structural
US-based LLM traffic converts at 3.50%. EU traffic converts at 0.41%. The gap represents a structural change at 8.5x, and it's not a behavioral difference. It's structural.
The US organizations in this dataset skew toward higher-intent verticals: beauty, health, and supplements, the categories where AI conversion rates run highest. The EU sample includes more browse-heavy categories like fashion, home decor, and lifestyle goods where consideration cycles are longer and LLM-referred purchase intent is more diffuse.
US vs. EU: LLM Conversion Rate
The 8.5x gap is structural (portfolio mix), not behavioral
Source: Alhena AI, 329 brands across US and EU markets
There's also a maturity factor. LLM adoption among US consumers and online shoppers is 6 to 12 months ahead of most EU markets. As AI-powered shopping experience tools spread across European markets and vertical coverage evens out, the conversion gap should narrow. But for now, organizations operating in both regions should set separate benchmarks and build region-specific AI e-commerce strategies rather than applying a single global target.
The portfolio mix explanation also applies to ad spend amplification. US brands running paid social see higher AI lift because their traffic lands on categories where AI closes the information gap fastest. EU brands in visual and lifestyle categories need AI strategies tuned to comparison shopping experience and style guidance rather than ingredient lookup, personalization, and compatibility matching.
Finding 6: Proactive Deployers Outperform Passive Ones by 5.5x
The single biggest lever in AI e-commerce performance isn't better models or richer data. It's activation.
Organizations that proactively surface AI shopping assistants based on visitor behavior (time on page, scroll depth, cart value thresholds, exit intent) see 5.5x higher engagement rates than brands that wait for shoppers to click a chat icon. That engagement gap translates directly into revenue because Alhena AI touches roughly 1% of total site visitors but drives approximately 10% of total revenue. The brands at 5.5x the average engagement rate are capturing 5.5x the revenue from the same visitor pool.
The math is simple. If your AI assistant converts visitors at 12% and your site average is 2%, every additional percentage point of visitor reach drives 6x the revenue of an equivalent reach increase through standard UX systems and improvements. Moving from 1% engagement to 3% engagement, all else equal, roughly triples your AI-attributed sales.
What does proactive implementation look like in practice? Trigger timing calibrated by traffic source. Contextual greetings that reference the product or category the visitor is browsing. Behavior-based escalation: if a visitor views three products without adding to cart, the AI intervenes with a recommendation. If a visitor opens the size chart twice, the AI offers sizing guidance. These aren't hypothetical implementation theories. The 5.5x engagement gap data comes from organizations already running these playbooks on Alhena.
Ad Spend Amplification: AI as a Multiplier on Paid Media
The 3x to 76x conversion lift data reframes how brands should think about paid media budgets. Every dollar spent on social ads, paid search, or shopping campaigns delivers more revenue when paired with on-site AI engagement. The amplification effect is measurable by channel.
- Short-form video ads: 76x conversion lift. AI turns the lowest-converting paid channel into one that delivers meaningful ROAS by bridging the gap between a 15-second video clip and a confident purchase decision.
- Paid social: 13.1x lift. Visitors arrive with moderate product awareness from the ad creative. AI validates their interest, handles comparison questions, and guides them to checkout.
- Paid search: 6.1x lift. The smallest multiplier, but applied to your highest-volume, highest-intent traffic, the absolute revenue impact often exceeds the social and video channels combined.
The implication: increasing ad spend without an AI engagement layer is leaving 3x to 76x of potential conversion on the table. Brands that pair media investment with AI-assisted e-commerce see compounding returns, where the ad drives the visit and the AI agents close the sale.
Forward Look: Three Shifts Reshaping AI Commerce in Late 2026
Zero-click commerce
AI platforms are increasingly moving from referring traffic to completing transactions without the shopper ever visiting a storefront. When the purchase happens within the AI conversation, the storefront becomes a fulfillment endpoint, not a digital commerce discovery layer. Companies that invest in structured product data feeds, inventory signals, for AI platforms now will capture share as zero-click e-commerce scales. The ones that don't will lose visibility at the exact moment the shopper is ready to buy.
AI share of voice as a tracking metric
How often does an AI platform recommend your brand when a shopper asks about your category? That's your AI share of voice, and it's increasingly becoming as important as search engine share of voice was a decade ago. Brands need to track their visibility within AI responses the same way they track organic rankings. The brands measuring this today will have a 12 to 18 month head start on those that wait.
The widening gap between early movers and laggards
The 5.5x engagement gap between proactive and passive AI deployers is accelerating. Early movers accumulate conversation data that trains their AI to sell better over time. Laggards start from zero. The increasingly compounding effect means the gap between brands that deployed AI in 2024 and those deploying in late 2026 will be larger than the gap between brands that adopted ecommerce in 2010 versus 2015. The data and value advantage builds on itself.
The Platform Powering These Insights
Alhena AI is the commerce intelligence platform behind this report. Every data point, from the 2.47% LLM conversion rate to the 5.5x engagement gap, comes from real transaction data across Alhena's 329-organization network. The platform combines two specialized AI agents: a Product Expert Agent trained on your full catalog (specs, reviews, compatibility data) and an Order Management Agent connected to your OMS, helpdesk, inventory management, and fulfillment systems.
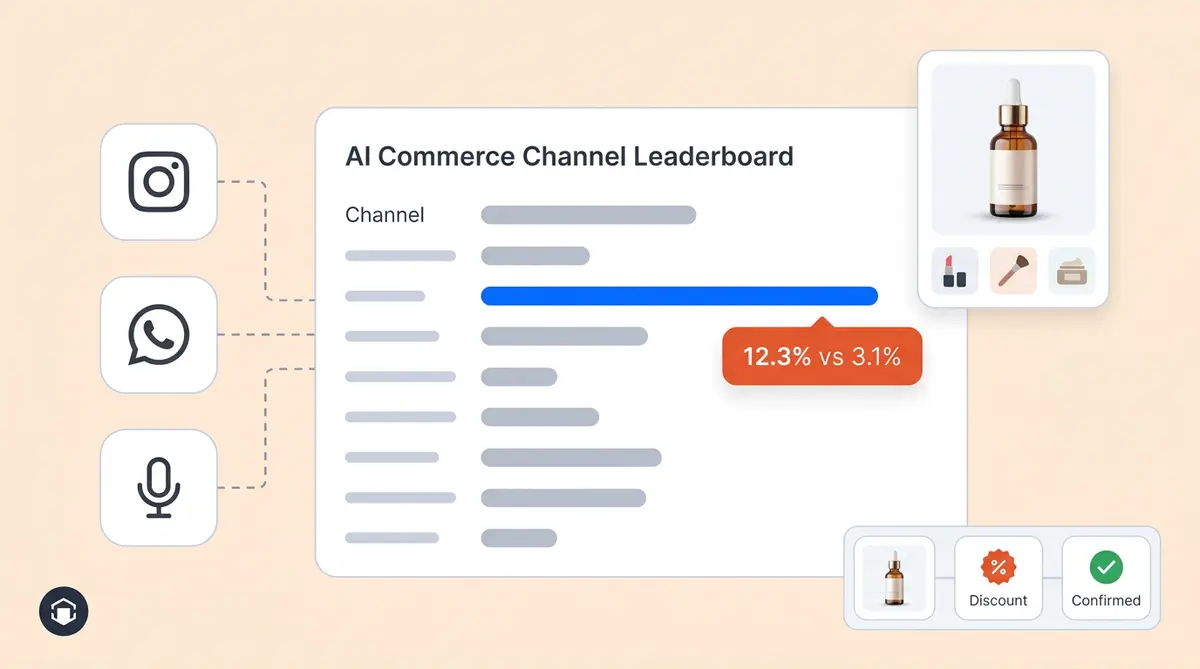
Alhena deploys in under 48 hours with no developer resources or implementation effort. It works across web chat, email, Instagram DMs, WhatsApp, and other omnichannel touchpoints, and voice. Built-in revenue attribution analytics track every AI-assisted conversation to a completed purchase, broken down by channel, vertical, and customer experience segment.
The AI is hallucination-free, grounded entirely in verified product data. Results from organizations on the platform: 3x conversion rates and 38% AOV uplift in beauty. 63% automated resolution with 90% CSAT in home furnishing. Response times from 40 minutes to 1 minute in travel. 86% deflection rate with 84% CSAT in garden and outdoor.
Ready to benchmark your brand against this dataset? Book a demo with Alhena AI to get vertical-specific benchmarks and channel conversion intelligence for your online store. Or start free with 25 conversations and measure the results yourself. Learn more and use the AI ROI calculator to estimate your revenue impact before you deploy.
Frequently Asked Questions
How does LLM-referred traffic compare to paid search and paid social for ecommerce conversion?
LLM traffic converts at 2.47%, outperforming paid search at 1.82% and paid social at 0.52% across 329 brands tracked by Alhena AI. It ranks 4th globally among all acquisition channels and grows 40% quarter over quarter at zero ad spend, making it the highest-ROI emerging channel in ecommerce.
What AI commerce benchmarks should DTC founders track across traffic channels?
Alhena AI's 329-brand dataset shows the key benchmarks are AI engagement rate (top performers hit 5.5x the average), AI-attributed revenue share (top 10% attribute 8 to 12% of total revenue to AI), cart-to-checkout completion (49.3% with AI vs. 26.3% without), and channel-specific conversion lift (3x to 76x depending on traffic source).
Which ecommerce verticals get the highest conversion rates from AI shopping assistants?
Beauty leads at 5.36%, followed by health and supplements at 4.68% and auto parts at 3.53%, based on Alhena AI's cross-vertical analysis. The pattern follows research intensity: verticals where shoppers ask specific, answerable questions before buying see the strongest AI conversion performance.
How does proactive AI deployment affect ecommerce revenue compared to passive chatbot placement?
Brands that proactively trigger Alhena AI based on visitor behavior see 5.5x higher engagement rates than those that wait for shoppers to click a chat icon. Since AI-engaged visitors convert at 12% versus a 2% site average, that engagement gap translates directly into a 5.5x revenue multiplier from the same visitor pool.
Can brands track their visibility inside AI-generated shopping recommendations?
Yes. Alhena AI tracks AI share of voice, measuring how often AI platforms recommend your brand when shoppers ask about your category. This metric is becoming as critical as organic search rankings. Brands monitoring it today gain a 12 to 18 month data advantage over those that wait.
What is the revenue impact of pairing AI shopping assistants with paid social and paid search campaigns?
Alhena AI amplifies paid media ROI by 6.1x on paid search, 13.1x on paid social, and 76x on short-form video ads. The lift comes from AI closing the information gap between ad exposure and purchase confidence. Brands running paid campaigns without on-site AI engagement leave 3x to 76x of potential conversion untouched.