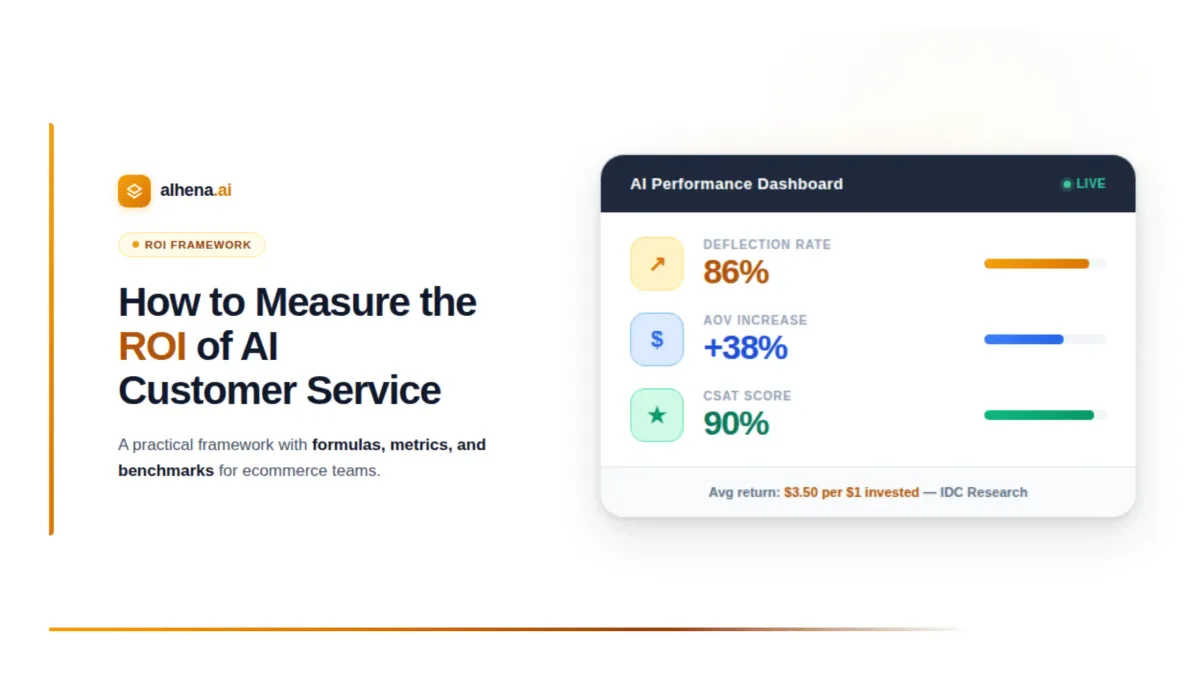
Companies see an average return of $3.50 for every $1 invested in AI, according to IDC research. Top performers report returns as high as $8 per dollar spent. Yet 80% of companies report limited material earnings impact from their AI initiatives, not because the technology fails, but because they cannot properly measure success.
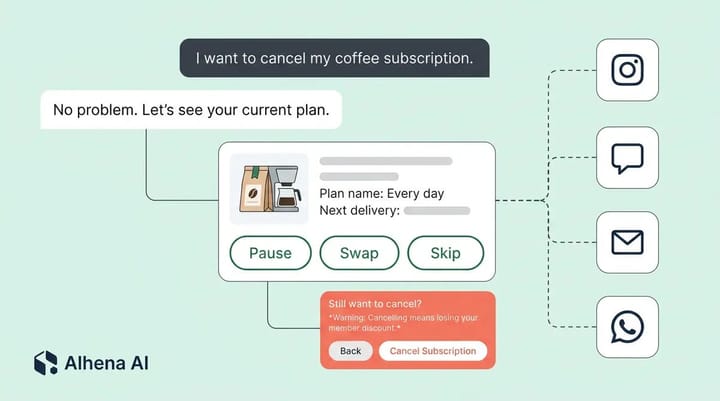
This gap is especially pronounced in e-commerce customer service. Many brands deploy an AI chatbot, see their ticket volume drop, and assume it is working. Others invest heavily and wonder why the CFO keeps asking for proof. The problem is rarely the AI itself; it is the absence of a measurement framework that captures the full picture: cost reduction, revenue generation, customer satisfaction, and operational efficiency.
Choosing the right tool matters just as much as measuring it. See our breakdown of the 10 best AI chatbots for ecommerce ranked by features, pricing, and real-world results.
This guide gives you that framework. By the end, you will have the exact metrics, formulas, and benchmarks you need to quantify the ROI of AI customer service for your e-commerce business and communicate it to any stakeholder. If you’re still evaluating tools, our <a href="https://alhena.ai/blog/ai-customer-service-guide-2026/">AI customer service guide</a> compares the best options for 2026.
The Three Pillars of AI Customer Service ROI
Most ecommerce teams make a critical mistake: they measure AI customer service ROI solely through cost savings. While cost reduction is important, it captures only about 30-40% of the total value. The full picture has three distinct pillars.
Pillar 1: Cost reduction. This is the most straightforward to measure. It includes reduced agent labor costs, lower cost per interaction, decreased training and onboarding expenses, and fewer escalations to senior staff.
Pillar 2: Revenue generation. This is where AI customer service in e-commerce diverges sharply from AI in other industries. A well-implemented AI assistant does not just resolve tickets; it drives sales. Revenue metrics include conversion rate improvements from guided selling, average order value (AOV) increases through intelligent upselling and cross-selling, recovered revenue from abandoned cart interventions, and customer lifetime value (CLV) improvements from better post-purchase experiences.
Pillar 3: Customer experience improvements. These are often dismissed as "soft metrics," but they have hard financial consequences. Higher CSAT scores correlate directly with repeat purchase rates. Faster response times reduce churn. Consistent omnichannel experiences build the loyalty that drives long-term revenue.
The Core Metrics You Need to Track
Here are the specific KPIs that form a complete AI customer service ROI dashboard for e-commerce, organized by pillar.
Cost metrics. Track your cost per resolution (CPR) before and after AI deployment. The gap between human and AI resolution costs is where most brands start their ROI analysis. Your cost per resolution (CPR) depends on agent salaries, benefits, tools, and overhead - and these vary by team size and region. For a detailed dollar-by-dollar breakdown of what these numbers look like in practice, see our AI ROI Calculator guide. The key is establishing your baseline CPR before AI deployment so you can measure the delta accurately.
The formula: Monthly cost savings = (Human CPR − AI CPR) × Number of AI-resolved tickets
Beyond CPR, track deflection rate (percentage of tickets resolved without human handoff), average handle time (AHT) reduction for agent-assisted tickets, and training cost savings from reduced onboarding needs as ticket complexity shifts.
Revenue metrics. Measure the AI-influenced revenue by tracking conversations that lead to a purchase within a defined attribution window. Alhena AI's Revenue Analytics traces every dollar back to the conversation that drove it, making this attribution straightforward. Key revenue KPIs include AI-attributed revenue (total sales where AI played a role in the shopping journey), AOV lift (comparing orders where AI assisted versus unassisted sessions), conversion rate on AI-guided sessions versus non-guided sessions, and cart abandonment recovery rate from AI interventions.
Experience metrics. CSAT scores for AI-handled interactions versus human-handled interactions tell you whether your AI is meeting customer expectations. Track first contact resolution (FCR) rate, since every unresolved ticket that requires follow-up costs you both money and satisfaction. Net Promoter Score (NPS) trends over time and ticket reopen rate (a reopen means the AI's resolution did not actually resolve the issue) are also essential indicators.
A Step-by-Step Framework for Calculating ROI
Follow this five-step process to calculate your AI customer service ROI with confidence.
For a deeper look at how AI CX compounds into higher customer lifetime value, see our CLV attribution framework.
Step 1: Establish your baseline. Before deploying AI (or using data from before your current AI was implemented), document your current cost per ticket, average handle time, CSAT score, deflection rate (likely near zero without AI), monthly ticket volume, and revenue per support interaction. Without a clear baseline, you cannot prove improvement.
Step 2: Calculate total AI investment. Include everything: platform subscription fees, implementation and integration costs, any consulting or customization, ongoing maintenance, and the time your team spends managing the AI system. Be honest about this number. Understating costs leads to inflated ROI figures that lose credibility.
Step 3: Measure cost savings. Apply the CPR formula above. Also calculate the labor hours freed by AI handling routine tickets. If your AI deflects 2,000 tickets per month at an average handle time of 8 minutes, that is 267 agent hours saved. Multiply by your fully loaded agent cost per hour.
Step 4: Measure revenue impact. If your AI platform provides revenue attribution (Alhena AI does this natively), use it directly. If not, compare conversion rates and AOV between AI-assisted and non-assisted sessions as a proxy. Brands using Alhena AI's Shopping Assistant have seen AOV increases of 20-38% and revenue contributions of over 11% from AI-driven interactions, based on published case studies with Victoria Beckham and Tatcha.
Step 5: Apply the ROI formula.
Check the ROI Calculator. For a step-by-step framework, see how to pitch AI customer service to your leadership team.
For a full breakdown of what each calculator output means and the hidden costs most tools miss, read our AI ROI Calculator guide. If you're a CMO preparing board-level reporting, our guide to AI-attributed revenue translates these metrics into the three numbers your board actually cares about.
Benchmarks: What Good Looks Like in 2026
It helps to know where top performers land so you can set realistic targets.
Ticket deflection rates for AI customer service in e-commerce typically range from 60-86%. Crocus, a major UK garden retailer, achieved 86% deflection rates with Alhena AI. CSAT scores for AI-handled interactions should match or approach human agent scores. Alhena AI customers consistently report 84-90%+ CSAT from AI interactions. Response time is where AI shines most dramatically; Manawa reduced response times from 40 minutes to under 1 minute after deploying Alhena AI. For revenue impact, leading brands report 10-20% of total ecommerce revenue being attributable to AI-assisted interactions.
Gartner projects that conversational AI will save $80 billion in global contact center costs by 2026, and companies using structured ROI frameworks achieve 40-60% higher returns than those relying on intuition. The companies seeing the best results are not just implementing AI; they are measuring it rigorously and optimizing continuously.
How Alhena AI Makes ROI Measurement Simple
One of the most common barriers to measuring AI ROI is the lack of unified analytics. When your shopping assistant, support bot, and agent assist tool are all separate products, stitching together a coherent ROI picture requires significant analytics work.
Alhena AI solves this by combining shopping and support in a single platform with built-in analytics. The Performance Analytics dashboard shows deflection rates, CSAT scores, resolution times, and ticket trends at a glance. The Revenue Analytics dashboard traces every sale back to the AI conversations that influenced it, giving you a direct line from AI investment to revenue generated.
Because Alhena AI operates as both an AI Shopping Assistant (driving pre-purchase revenue) and an AI Support Concierge (reducing post-purchase costs), you capture both sides of the ROI equation in one system. Brands like Puffy achieved 63% automated resolution while maintaining 90% CSAT, and Victoria Beckham saw a 20% AOV increase, both with clear, attributable measurement through Alhena AI's analytics. Read the customer success stories.
The platform deploys in under 48 hours and begins generating measurable data from day one. Most Alhena AI customers report seeing quantifiable impact within the first week of deployment, with full ROI realization within 30-60 days.
Key Takeaways
Measuring AI customer service ROI is not optional, it is the foundation that secures continued investment, guides optimization, and proves the strategic value of your CX operations. The brands that treat AI customer service as a measurable revenue channel, not just a cost-reduction tool, are the ones achieving returns of $3-8 per dollar invested.
Start with your baseline, track the three pillars (cost, revenue, experience), and apply the ROI formula monthly. The data will make the case better than any pitch deck ever could.
Need to present these results to your leadership team? Our CMO's guide to AI-attributed revenue shows how to reframe AI metrics as revenue growth, margin expansion, and competitive positioning that boards fund.
Ready to deploy AI customer service with built-in ROI measurement? Book a demo with Alhena AI or start for free.
Frequently Asked Questions
What KPIs should I track for AI chatbot customer service?
The essential KPIs and metrics span three categories. For cost saving: track cost per resolution, deflection rate, average handle time, and agent hours saved, these metrics help you calculate ROI and measure operational cost reduction effectively. For revenue: measure AI chatbot-attributed sales, AOV lift, conversion rate on bot-assisted sessions, and cart recovery rate. For customer experience: monitor CSAT, first contact resolution rate, NPS, and ticket reopen rate. Tracking the right KPIs ensures your chatbot investment delivers measurable performance gains across every use case.
How do I calculate ROI for an AI chatbot?
To calculate the ROI of your AI chatbot, start by identifying your baseline costs, including average cost per interaction, live agent salaries, and call center overhead. Then compare those against post-automation metrics: tickets deflected, response time improvements, and agent efficiency gains. A simple ROI calculation formula is: (Total Savings + Revenue Gains – AI Investment) ÷ AI Investment × 100. For a more accurate estimate, use an ROI calculator that factors in both cost saving and revenue attribution. Most brands find that the return on investment becomes clear within the first 30–60 days of implementation.
What is cost per resolution for AI chatbots versus live agents?
A human-handled support ticket typically costs $5-12 per interaction when fully loaded (salary, benefits, tools, call center overhead). An AI chatbot-resolved ticket costs $1.00-2.00, depending on the platform and complexity. For a brand handling 10,000 tickets per month, shifting even 60% to the bot can save $30,000-60,000 monthly in direct resolution costs. This cost reduction is one of the most immediate ways to boost ROI and cut costs across your customer service operations.
How do you calculate deflection rate savings?
Deflection rate measures the percentage of tickets resolved by a chatbot or AI agent without live agent handoff. To calculate the savings: multiply your deflection rate by total monthly ticket volume to get tickets deflected, then multiply by your average cost per ticket. For example: 70% deflection × 5,000 conversations × $8 per ticket = $28,000 in monthly saving. This calculation helps you estimate the direct operational cost impact of automation and maximize efficiency across your support team.
Can AI customer service actually drive revenue, not just cut costs?
Yes, and this is where many teams underestimate AI's value. AI chatbots and AI agents drive revenue through guided product discovery, intelligent upselling, and abandoned cart recovery. By personalizing every chat interaction, a bot can effectively boost engagement and conversion. Alhena AI customers have seen AOV increases of 20-38% and direct revenue contributions exceeding 11% of total ecommerce revenue from AI-assisted shopping conversations. The value add goes well beyond cost reduction, it's a revenue engine.
How does Alhena AI measure revenue attribution from AI conversations?
Alhena AI's Revenue Analytics dashboard tracks every customer interaction from first AI chatbot touchpoint through to completed purchase. It attributes sales to bot-assisted sessions using direct attribution (customer purchased during or immediately after an AI conversation) and influenced attribution (customer engaged with the chatbot during the browsing journey before converting). These metrics give brands a clear, auditable line from AI investment to revenue generated, making it easy to calculate ROI and optimize your customer service strategy for maximum performance.
What customer service use cases can an AI agent automate?
AI agents excel at automating high-volume, repetitive use cases such as order tracking, returns and exchanges, product recommendations, FAQ responses, and appointment scheduling. By handling these interactions, AI frees up human agents and sales reps on your support team to focus on complex or high-value conversations. Brands that implement AI-powered automation strategically see significant improvements in response time, service quality, and overall customer experience, all of which contribute to a stronger return on investment. As adoption grows, the AI becomes more effective, handling a larger share of your contact center volume while maintaining the customer satisfaction levels your CX team demands.