Most Ecommerce Brands Sit on a Goldmine of Conversation Data
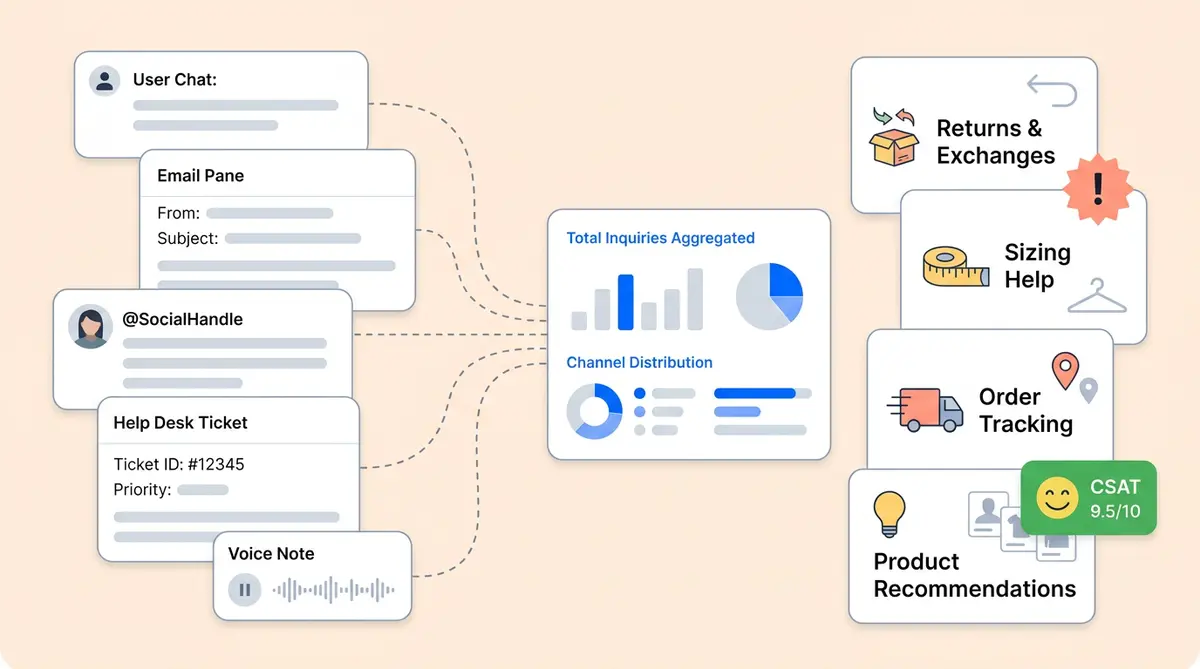
Ecommerce brands generate thousands of customer interactions and conversations every month across chat, email, social DMs, help desks, and other customer interactions. According to Fortune Business Insights, the conversation intelligence market will reach $32.25 billion by 2026, growing at 13% annually through 2026. The demand for enterprise conversation intelligence is clear: companies want to know what customers are saying, not just how many tickets they closed.
But here's the gap. Most support tools count conversations. They tell you volume went up 12% last month. They don't tell you why. They don't perform sentiment analysis or show you that returns questions spiked 38%, that sizing confusion is driving 60% of human handoffs, or that negative CSAT clusters around shipping-policy answers.
Alhena's conversation analytics layer exists to close that gap. It turns raw customer interactions and support exchanges into structured, topic-level business intelligence that connects to AI performance, customer sentiment, escalation patterns, satisfaction scores, sentiment patterns, and revenue. This post walks through exactly how it works, from automatic topic tagging to hypothesis-driven conversation reviews.
What Most Conversation Analytics Software Gets Wrong
The typical analytics dashboard in a help desk or chatbot platform gives you three things: total conversations, average response time, and maybe a CSAT score. Zendesk Explore shows ticket volume and agent productivity. Intercom's reporting tracks resolution rates. Gorgias provides revenue-per-ticket metrics. These are useful numbers, but they're surface-level.
The problem is that none of them answer the question that actually matters: what are your customers talking about, and how is that changing over time?
Manual ticket tagging is the usual workaround. Agents pick from a dropdown of categories before closing a ticket. According to Unthread's 2026 tagging research, manual classification accuracy hovers around 60-70%. When things get busy, agents skip tags entirely, pick the wrong category, or default to "General Inquiry." The result is analytics built on unreliable data, which hurts both customer experience and decision-making.
And even when tags are accurate, they're flat. A tag like "Returns" doesn't tell you whether the customer wanted to start a return, was confused about the return window, or was frustrated that their refund hadn't arrived. Semantic depth and sentiment context matter, and manual tags don't capture it.
How Alhena's Conversation Analytics Captures Data
Alhena's conversation analytics starts at the data layer. Every customer interaction is captured and stored with rich metadata from all customer interactions, regardless of the data sources it originates from.
Omnichannel conversation capture
Alhena collects conversations from every channel it operates on: website chat widgets, FAQ interactions, help desk integrations (through Zendesk, Freshdesk, Gorgias, and others), email, social channels like Instagram DMs and WhatsApp, and voice interactions. Each conversation is a complete record, not a summary or a sample.
Metadata that goes beyond the transcript
Each conversation stores more than just the messages. Alhena captures:
- Source and channel (website chat, Instagram DM, Zendesk ticket, etc.)
- AI profile that handled the conversation
- Date, time, and page URL where the chat started
- Human handoff status (whether a live agent was needed)
- CSAT rating, sentiment signals, and selected feedback from the customer
- Cart and checkout signals (products viewed, cart additions, completed purchases)
This metadata layer is what separates Alhena's conversation analytics from tools that only store transcripts or focus narrowly on speech analytics for call centers. When you can tie a conversation to a specific product page, a cart event, and a satisfaction score, the analysis becomes actionable, and the customer experience improves.
How Topic Tagging Works Under the Hood
Topic tagging is the organizing layer that makes conversation analytics useful. Without it, you have thousands of individual chats. With it, you have patterns.
AI-generated topics from real customer questions
Alhena's topic generation process runs on a regular schedule, looking at the most recent 30 days of customer questions. Unlike tools that use basic NLP keyword extraction, Alhena doesn't rely on keyword matching, basic NLP rules, or predefined categories. Instead, it uses an NLP-powered clustering approach:
- Recent questions are collected from across all channels
- Similar questions are grouped using cluster IDs assigned through Alhena's AI server
- The system samples the newest unique clusters so that repeated, high-volume questions don't dominate the topic list
- An LLM reviews the clustered questions and generates clear, high-level topic names with descriptions
The output is a set of customer-specific topics like "Order Tracking and Delivery," "Returns and Exchanges," "Sizing Help," or "Product Recommendations." These aren't generic templates. They're generated from your customers' actual language and concerns.
Smart safeguards in topic generation
Alhena's topic engine includes several guardrails to keep the system clean:
- Volume threshold: Topics are only created when there's enough conversation volume to justify them. One-off questions don't get their own category.
- Duplicate prevention: The system checks against existing topics before creating new ones.
- Cap per AI profile: AI-generated topics are currently capped at 10 per profile, keeping the taxonomy focused and actionable.
- Admin control preserved: Topics created manually by your team are never overwritten by AI generation. You can edit, rename, or create your own conversation analytics categories alongside the AI-generated ones.
- "Other" catch-all: Conversations that don't match active topics fall into an "Other" bucket, so nothing gets lost.
Companies that skip topic generation entirely don't get categorization. But companies that let AI handle it get a continuously improving taxonomy that reflects what customers actually care about right now.
From Raw Conversations to the Trending Topics Dashboard
Once topics are assigned, Alhena's conversation analytics dashboard brings them to life. In the Analytics > Trending Topics view, teams can spot patterns they'd never find in raw ticket logs.
What the chatbot analytics dashboard shows
Alhena's conversation analytics trending topics dashboard includes:
- Topic list sorted by conversation volume,, so you immediately see what customers ask questions about most
- AI-generated topic indicators that distinguish between system-created and admin-created categories
- Conversation count per topic with exact numbers
- Trend visualization charts over time showing how topic volume changes week over week or month over month
- Human-transferred conversations by topic,, revealing which subjects trigger escalation to live agents
- Filters for AI profile, integration source, and date range so you can slice the data any way you need
- Conversation drilldown to read the actual chats behind any topic
The power here is in the progression. A team can go from "we had 4,000 conversations last month" to "returns questions rose 38%, handoffs are concentrated in sizing, and negative CSAT is mostly coming from shipping-policy confusion." That's the difference between basic conversational analytics and real insight.
From insight to action
When you spot a topic trend, you can drill into the conversations behind it. Read the actual customer messages. See where the AI answered well and where it fell short, and whether customer sentiment was positive or negative. Then take action: update your knowledge base, add a guideline for the AI agent, or flag the issue for your product team.
Brands like Tatcha use this kind of conversational analytics and conversation intelligence feedback loop to tune their AI's performance. When the AI can see that "Sizing Help" generates the most human handoffs, and the team updates the sizing knowledge base in response, the handoff rate drops. Tatcha achieved an 82% chat deflection rate while maintaining a 3x conversion rate through this kind of data-driven improvement.
CSAT by Topic: Finding Pain, Not Just Popularity
Volume alone doesn't tell you where customers struggle. A topic with 500 conversations and a 4.5 CSAT score is healthy. A topic with 200 conversations and a 2.8 CSAT score is a fire.
Alhena's topic layer feeds directly into CSAT analytics, letting teams see satisfaction broken down by topic. For each topic, you can view:
- Average rating across all rated conversations
- Positive CSAT share (typically the percentage of 4- and 5-star ratings)
- Total number of ratings so you know the sample size
- Top positive and negative selected feedback options showing customer sentiment trends and what buyers highlight
- Free-text feedback from customers who wrote additional comments
This is where conversational analytics becomes a product intelligence tool, not just a support metric or basic data analytics exercise. If your "Product Recommendations" topic has a 4.7 CSAT but your "Shipping Policy" topic sits at 2.9, you know exactly where to focus. Your AI Shopping Assistant is doing great work recommending products, but your shipping answers need attention.
Crocus used Alhena to reach an 84% CSAT score while maintaining an 86% deflection rate. That combination only happens when you know which topics the AI handles well and which ones need improvement. Conversational analytics makes that visible.
The Deeper Analysis Pipeline: Hypothesis-Driven Reviews
Beyond the dashboard, Alhena offers a deeper analysis pipeline for teams that want to go further. Think of it as a dedicated conversation analyst. For example, imagine reviewing hundreds or thousands of tickets with specific hypotheses in mind. Here are examples of hypotheses teams commonly test.
How hypothesis-driven analysis works
The pipeline fetches conversations from a date range and enriches each one with signals that go beyond the transcript:
- Whether a quiz was offered and completed
- Whether a product recommendation was made
- Whether the conversation was transferred to a human agent
- Whether the session ended in a purchase or cart event
- CSAT score, sentiment rating, and feedback
- Product FAQ context (what knowledge the AI used to answer)
An AI analyst then reviews the enriched dataset against specific hypotheses. For example:
- "Users drop off because quizzes are too long."
- "Human handoffs happen because the AI misses intent."
- "Product recommendations don't match customer needs."
- "Knowledge gaps are causing generic answers."
- "Positive CSAT is driven by faster, more personalized responses."
Actionable output, not just data
The output is a structured report with verdicts, evidence (including specific ticket IDs), findings, and concrete recommendations. Those recommendations map directly to things you can do in Alhena:
- Add a guideline to improve how the AI handles a specific scenario
- Update the knowledge base to fill an information gap
- Enable a specialized agent (like the Support Concierge or the Order Management Agent) for a topic that needs it
- Add human feedback to train the AI on specific edge cases
- Improve the conversation flow for a common customer journey
This closes the loop between analytics and action. You don't just see what's happening in your conversation data. You see why it's happening, and you get a specific playbook to fix it.
What This Means for Your Ecommerce Team
Conversational analytics with topic tagging changes how your conversation analytics data helps support, product, and marketing teams work together. Marketing can spot which customer conversations mention competitors, track brand sentiment, and identify themes for campaigns. Here's what it looks like in practice.
For support teams
Instead of guessing which topics need more training content, you see the data. The Agent Assist feature works alongside human agents, and the conversation analytics can show where agents get pulled in most often. Manawa used this approach to cut their support workload by 43% and reduce response times from 40 minutes to 1 minute.
For product teams
Customer conversations are the most direct source of product feedback. When "Sizing Help" is your second-highest topic and 40% of those conversations result in human handoffs, your sizing guide probably needs work. When "Product Recommendations" conversations correlate with high cart additions, your AI is doing its job as a shopping assistant.
For leadership
Revenue attribution via conversation analytics completes the picture. Alhena's built-in revenue analytics connect conversation topics to actual purchases. You can see which topics drive revenue and which ones cost you sales. Victoria Beckham saw a 20% AOV increase through AI-assisted conversations, and the analytics can show exactly which conversation patterns drove that lift.
Key Takeaways
- Alhena's conversational analytics goes beyond volume counts to show what customers are asking about, where the AI succeeds or struggles, and how satisfaction changes by topic.
- AI-powered topic tagging replaces manual categorization (60-70% accuracy) with NLP-driven semantic clustering that's regularly refreshed based on real customer questions.
- The trending topics dashboard connects topic volume, escalation rates, and CSAT in a single view with drilldown into individual conversations.
- CSAT by topic reveals painful topics, not just popular ones, directing your team's attention to where it matters most.
- The hypothesis-driven analysis pipeline produces actionable recommendations (update knowledge base, add guidelines, enable agents) directly from conversation evidence.
- Conversational analytics feeds a continuous conversation intelligence loop that connects support, product, customer experience, and revenue data across every channel Alhena operates on.
Ready to turn your customer conversations into structured intelligence? Book a demo with Alhena AI to see conversation analytics and topic tagging in action, or start for free with 25 conversations.
Frequently Asked Questions
What is conversation analytics in ecommerce?
Conversation analytics is the practice of applying natural language processing and machine learning to every customer query and interaction across chat, email, social, and voice channels. In ecommerce, a conversational AI analytics platform does more than count tickets. It uses natural language understanding to parse unstructured conversation data, identify customer intent, detect sentiment, and map topics to business outcomes like revenue and CSAT. The goal is to turn raw, messy customer conversations into structured datasets that support, product, and CX teams can all act on.
How does Alhena’s topic tagging differ from manual ticket tagging?
Manual ticket tagging relies on agents picking categories from a dropdown, which achieves only 60-70% accuracy according to industry research. Alhena’s AI-powered topic tagging uses semantic clustering to automatically analyze customer queries from the last 30 days, grouping similar questions into meaningful categories. The system identifies patterns across large datasets rather than relying on a single agent’s judgment call. Topics like “Sizing Help” or “Returns and Exchanges” are generated from your customers’ actual language, and the process runs on a regular schedule so categories stay current without manual effort.
Can I create custom topics alongside AI-generated ones?
Yes. Alhena’s analytics platform preserves any topics you create manually and never overwrites them with AI generation. You can edit, rename, or add your own categories alongside the AI-generated topics. The system caps auto-generated topics at 10 per AI profile to keep the taxonomy focused. This gives you an analytics tool that combines your team’s domain knowledge with AI-discovered patterns, so you can optimize topic coverage for your specific use cases without losing control.
How does Alhena connect CSAT scores to specific conversation topics?
Alhena’s topic layer feeds directly into CSAT analytics. For each topic, you can see the average rating, positive CSAT share, total number of ratings, top positive and negative selected feedback options, and free-text customer comments. This makes it easy to identify painful topics rather than just popular ones. For example, if “Shipping Policy” conversations have a 2.9 average while “Product Recommendations” sits at 4.7, you have a clear, data-driven signal for where to improve. These customer insights let data drive prioritization, helping CX leaders focus fixes that move satisfaction scores across the board.
What channels does Alhena’s conversation analytics cover?
Alhena captures conversational data from website chat widgets, FAQ interactions, help desk integrations (Zendesk, Freshdesk, Gorgias, and others), email, social channels like Instagram DMs and WhatsApp, voice interactions, and contact center systems. Each conversation is stored as a complete record with metadata including source, AI profile, page URL, handoff status, CSAT rating, and cart or checkout signals. Whether you run a dedicated contact center or handle support through a mix of channels, every interaction feeds into the same conversational analytics dashboard.
Is Alhena’s conversation analytics available in real time?
Conversations are captured in real time as they happen across all channels. The topic discovery and assignment process runs on a regular schedule rather than in real time, pulling from the latest 30 days of questions. The dashboard itself is powered by precomputed analytics tables that are continuously updated, giving you current data without delays. This approach balances speed with accuracy: you get fresh conversational insights for day-to-day decisions while the AI has enough context to automate topic generation reliably.
What is hypothesis-driven conversation analysis?
It’s Alhena’s deeper analysis pipeline for structured reviews. The system fetches conversations from a date range, enriches them with signals like quiz completion, product recommendations, human transfers, and purchase events, then tests specific hypotheses. For example: “Human handoffs happen because the AI misses customer intent” or “Knowledge gaps are causing generic answers.” The output is a report with verdicts, evidence, and concrete recommendations such as updating the knowledge base, adjusting model training data, or enabling a specialized agent. It’s a practical use case for turning conversational data into a continuous improvement cycle.
How does conversation analytics help optimize AI agent performance?
The analytics create a continuous feedback loop, and the AI power behind it grows over time. Topic trends identify where the AI handles questions well and where it struggles. CSAT by topic reveals which answers frustrate customers, and sentiment analysis highlights shifts in customer mood across different subject areas. Each finding maps to a specific action: add a guideline, update the knowledge base, refine model training, or enable a specialized agent for a tricky topic. Brands that use this data-driven approach see measurable gains. Tatcha, for instance, reached 82% chat deflection and 3x conversion rates by acting on conversational analytics insights rather than guessing.
How much does Alhena’s conversational AI analytics cost?
Conversation analytics, topic tagging, and the CX dashboard are all included in Alhena’s platform at no extra charge. You can start with 25 free conversations to see the analytics tool in action. For detailed pricing based on your conversation volume and channel needs, visit the pricing page at alhena.ai/pricing or use the ROI calculator at alhena.ai/roi-calculator to estimate your return. Unlike some conversational AI platforms that lock analytics behind premium add-ons, Alhena bundles the full analytics suite with every plan.