The Biggest Mistake Ecommerce Teams Make with AI
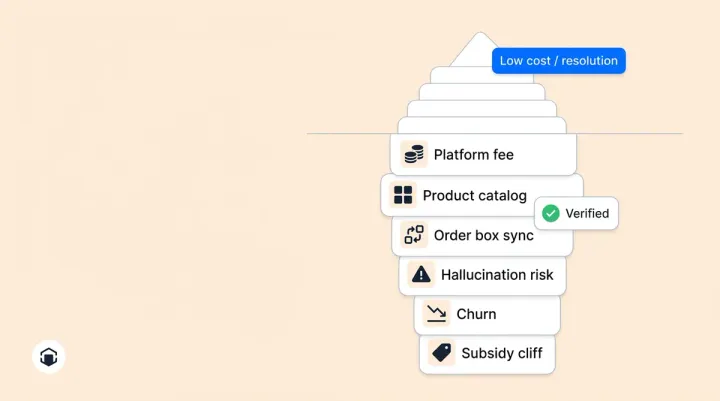
Three months after launch, the meeting goes like this: "The AI shopping assistant seems to be helping." "Customers seem happier." "I think we're getting more sales." Seems. Think. Feel. Your customers kept buying (or didn’t), your users kept chatting (or didn’t), and no one brought numbers because no one defined what success looked like before deployment. The business case dies right there, not because the AI failed, but because the team can't prove it worked.
For a step-by-step look at the deployment process, see how Alhena AI goes live in under 48 hours.
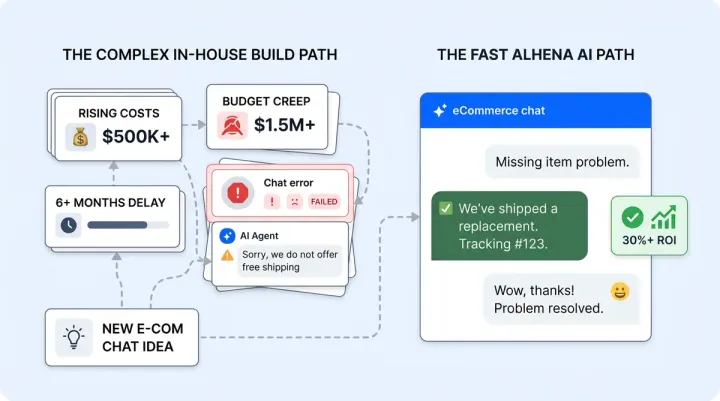
Fewer than one in five companies track well-defined KPIs for their generative AI solutions, according to McKinsey. That gap between investment and measurement is why 68% of AI ecommerce projects never make it past pilot. This post gives you the specific AI shopping assistant KPIs every ecommerce team should define before launch, organized into three scorecards with target ranges drawn from real deployment data across hundreds of ecommerce brands.
Three Scorecards, Not One Metric
A single number can't capture whether your AI shopping assistant is working. Revenue matters, but so does operational efficiency and customer experience. Define targets across all three scorecards before launch day, and you'll have a complete picture from week one.
Think of it this way: revenue tells you if the conversational AI is selling, efficiency tells you if it's saving, and quality tells you if customers actually want to use it again. Skip any one of these and you're making decisions with blind spots. Unlike basic chatbots that only handle simple queries, a conversational AI shopping assistant drives real purchasing decisions.
Scoreboard 1: Revenue (The Primary Measure)
Revenue is the scoreboard that earns budget renewals. Your sales and marketing teams both need these numbers to justify continued investment across channels. These are the ecommerce AI metrics your leadership team will care about most.
Conversion Rate Lift: AI-Engaged vs. Non-Engaged Sessions
Compare the purchase rate of shoppers who interact with your AI shopping assistant against those who don't. The gap tells you exactly how much the AI influences buying decisions. Target a 3 to 10% lift in the first eight weeks, depending on your vertical and baseline. AI shopping assistants that engage shoppers with guided product discovery outperform passive agents and generic assistants every time. Beauty and fashion brands with strong guided selling tend to land at the higher end. Stores with high traffic and repeat visitors often see faster growth because the AI has more conversations to learn from. General merchandise stores typically start closer to 3 to 5%.
AOV Change for AI-Assisted Shoppers
When an AI assistant recommends complementary products, builds routines, or assembles outfits, basket size grows. Target a 15 to 40% AOV uplift for brands deploying guided selling and routine-building features. Tatcha saw a 38% AOV increase, and Victoria Beckham hit 20%. If your AI only provides basic responses without personalized product recommendations or cross-sells, expect the lower end of that range.
Total Revenue Attribution
This is the dollar value traced from AI conversations to completed purchases. Not estimated, not modeled, but tracked end-to-end from chat interaction to order confirmation. The revenue per AI-assisted session should be a number your finance team can verify. Tatcha reached 11.4% of total site revenue from AI-powered sessions. Define your target as a percentage of total revenue and review it monthly. This single number is what turns "the AI seems helpful" into "the AI generated $420,000 last quarter."
Scoreboard 2: Efficiency (The Cost Justification)
Efficiency KPIs show how much human workload the AI absorbs. These are the ecommerce AI metrics your operations team watches.
Automation Rate
The percentage of customer queries your AI resolves without human involvement. Target 70 to 80% or higher for mature deployments within the first month. Crocus reached 86%. Manawa automated 80% of inquiries. If your rate sits below 50% after 30 days, the most likely cause is gaps in your product catalog or knowledge base, not a flaw in the AI bot itself. Review the accuracy of your product data, train the AI agents on missing topics, and make sure your AI tools surface the right information. Ecommerce brands using AI platforms with weak product data will see low automation no matter how good the AI agents are.
Ticket Deflection by Category
Don't just track the overall deflection number. Break it down by question type: order status, returns and exchanges, sizing and fit, shipping timelines, product comparisons. This breakdown reveals which categories your customers ask about most and where AI responses handle the volume best and where it still needs training data. Most brands see order status and shipping queries automated first, with sizing and fit queries improving as the conversational AI learns from more customer interactions. The conversational flow gets smarter with each interaction.
Average Resolution Time: Before vs. After
Measure the resolution speed for both AI agent-handled and human agent-handled tickets. Resolution time is one of the most tangible ecommerce AI metrics because every minute saved per resolution means your agents handle more ecommerce customers per shift. The AI should resolve common questions in seconds, but it should also make your human agents faster by handling repetitive ecommerce order inquiries and common volume. Manawa cut response time from 40 minutes to 1 minute while reducing team workload by 43%. Set your baseline now and track weekly.
Scoreboard 3: Quality (The Trust Check)
Speed and savings don't matter if the experience is bad. This is where most AI chatbots and basic AI tools fall short. Quality KPIs protect your brand and catch problems before customers leave.
CSAT for AI Interactions vs. Human Baseline
Track customer satisfaction on AI-handled conversations separately from human-handled ones. Your target: within 2 to 5 points of your human agent CSAT score. Some brands exceed human scores entirely. Puffy maintained 90% CSAT across AI-resolved conversations. If your ecommerce AI falls more than 5 points below your human baseline, your customers are noticing. Ecommerce customers expect accurate, fast answers, review conversation transcripts for accuracy gaps, tone mismatches, or premature escalation.
Conversation Depth (Messages per Session)
Deeper conversations correlate with higher conversion, because the shopper is engaged, not frustrated. Track average messages per AI session and watch for two signals. If depth increases while conversion also rises, the AI is guiding shoppers through meaningful product discovery. If depth increases but conversion stays flat, shoppers might be going in circles, asking the same question different ways because they're not getting useful answers.
Escalation Rate
The percentage of conversations handed off to a human agent. Too high means the AI needs training on more topics. But suspiciously low can be worse: it may mean the AI is giving shallow or incorrect answers instead of routing genuinely complex issues to your team. A healthy escalation rate for a well-tuned ecommerce AI shopping assistant typically falls between 15 and 30%. Audit a sample of non-escalated conversations weekly to make sure quality holds.
Setting Realistic Targets: What the Data Shows
These ranges come from real deployment data, not theoretical projections:
- Conversion lift: 3 to 10% in the first 8 weeks
- AOV improvement: 15 to 40% for brands with guided selling and routine building
- Automation rate: 70 to 80%+ within the first month
- CSAT: Within 2 to 5 points of your human agent baseline
- Escalation rate: 15 to 30% for a well-tuned assistant
Lock these in before launch. Write them down. Start tracking from day one, not day thirty. The ecommerce brands that get the most from AI tools are the ones that start tracking before deployment, not after. Share them with your leadership team. When the numbers come in, the decision to scale or stop should be obvious, not debatable. You can then optimize each scoreboard independently. Ecommerce brands on the best AI platforms optimize continuously, not quarterly.
The Timeline: Give Each KPI Its Window
AI performance compounds over time as the agentic system keeps learning from conversations. Every AI generated response improves the AI model, so you can optimize results week over week rather than waiting months. Week-one numbers should not be compared to week-eight targets. Here's the cadence that works:
- Week 1 to 2: Automation rate and resolution time stabilize. These are your earliest signals.
- Week 3 to 4: CSAT trends emerge with enough conversation volume to be meaningful.
- Week 4 to 8: Conversion lift and AOV change become statistically reliable.
- Month 2 to 3: Revenue attribution data is large enough to report confidently.
Commit to a minimum of 4 to 8 weeks before making a judgment call. AI agents need time to learn shopper behavior, and shoppers need time to build trust with AI agents. Review weekly to track trajectory, but don't overreact to early noise. The brands that pull the plug at week two based on incomplete data miss the compounding gains that show up in month two.
The ROI Test: One Number That Decides Everything
After 60 days, run this test: does total AI-attributed revenue exceed total platform cost? If yes, you have positive ROI and a clear case to scale. If no, review which scoreboard fell short and whether the gap is closing week over week.
This is not a feeling. It's a calculation you should be able to pull from your analytics within the first 60 days of deployment. If you can't, your measurement infrastructure has a gap that needs fixing before you evaluate the AI.
How Alhena AI Makes This Framework Actionable
Alhena AI is purpose-built for ecommerce, which means the three scorecards above are tracked automatically from day one:
- Revenue analytics: AI-attributed revenue, conversion lift, and AOV change tracked by engagement source (chat, FAQs, nudges) so you can see which interactions drive purchases.
- Performance analytics: Automation rate, deflection broken down by category, and resolution time comparisons between AI-handled and human-handled tickets.
- Built-in CSAT collection: Satisfaction surveys collected within the conversation flow, not in a separate email days later when the customer has forgotten the interaction.
- Flagged conversations for quality auditing: The platform surfaces conversations that need human review, keeping your quality scoreboard honest without requiring you to read every transcript. Your customers get better answers, and your team catches real world insights into what the AI sales agent does well and where it needs work.
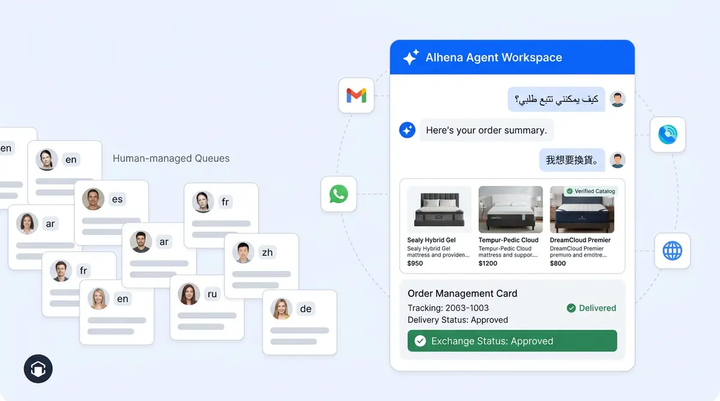
Brands using AI for personalization and guided selling see the fastest results. Alhena deploys in under 48 hours, connects to Shopify, WooCommerce, Magento, and Salesforce Commerce Cloud, and works across web chat, email, Instagram DMs, WhatsApp, and voice. Your KPI data flows across all channels into your existing ecommerce tools from day one, giving you visibility into how visitors, customers, and repeat buyers interact with your AI across every channel. That visibility is what drives growth.
Key Takeaways
The brands who prove AI ROI fastest are not the ones with the best AI. They are the ones who defined what success looks like before they launched. When the numbers came in, the decision was obvious.
- Define all three scorecards (revenue, efficiency, quality) before your AI shopping assistant goes live.
- Set specific target ranges, not vague goals. "Increase sales" is not a KPI. "3 to 10% conversion lift in 8 weeks" is.
- Give each metric its natural timeline. Don't judge revenue attribution at week one.
- Run the ROI test at 60 days: AI-attributed revenue vs. platform cost. That single comparison determines whether to scale.
Ready to put this framework into practice? Book a demo with Alhena AI and see the three scorecards in action, or start for free with 25 conversations and track your KPIs from day one.
Frequently Asked Questions
What is the single most important KPI to track for an AI shopping assistant?
AI-attributed revenue. It traces the dollar value from AI conversations to completed purchases and gives leadership a concrete number instead of subjective impressions. Alhena AI tracks this automatically by engagement source, so you can see exactly which interactions drive sales.
How long does it take to see significant results from an AI shopping assistant?
Operational metrics like automation rate and resolution time stabilize within 1 to 2 weeks. Revenue metrics like conversion lift and AOV change need 4 to 8 weeks to become statistically reliable. Alhena AI recommends a minimum 8-week evaluation window with weekly reviews to track trajectory.
Should I measure CSAT separately for AI-handled conversations?
Yes. Tracking AI CSAT independently from human agent CSAT reveals whether your customers trust and prefer the AI experience. Alhena AI collects satisfaction ratings within the conversation flow itself, giving you clean data without relying on follow-up emails that most shoppers ignore.
What is a realistic automation rate target for an ecommerce AI assistant?
Target 70 to 80% within the first month for a well-configured deployment. Brands using Alhena AI regularly exceed this, with Crocus reaching 86% and Manawa hitting 80%. If your rate stays below 50% after 30 days, focus on filling gaps in your product catalog and knowledge base content.
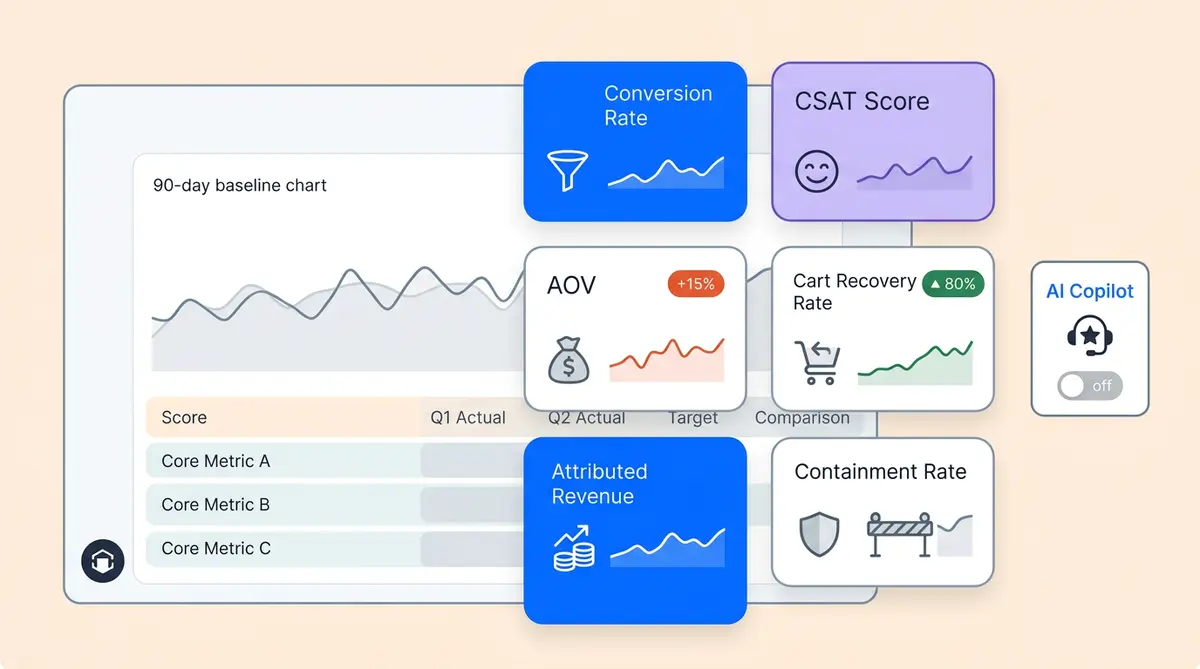
How do I connect AI shopping assistant metrics to overall business performance?
Use the three-scoreboard approach: revenue KPIs (conversion lift, AOV, attributed revenue), efficiency KPIs (automation rate, deflection by category, resolution time), and quality KPIs (CSAT, conversation depth, escalation rate). Alhena AI surfaces all three in a single dashboard so your team reviews one report, not five. Every agent, every channel, every metric that matters in a single view with clear answers.