The Measurement Blind Spot in AI CX
Most ecommerce brands measure AI success each transaction. Conversion rate lift. AOV increase. Ticket deflection. These metrics prove AI works in the moment, but they miss the compounding LTV effect entirely. AI agents that engage customers across the full lifecycle capture value that session-level tools miss.
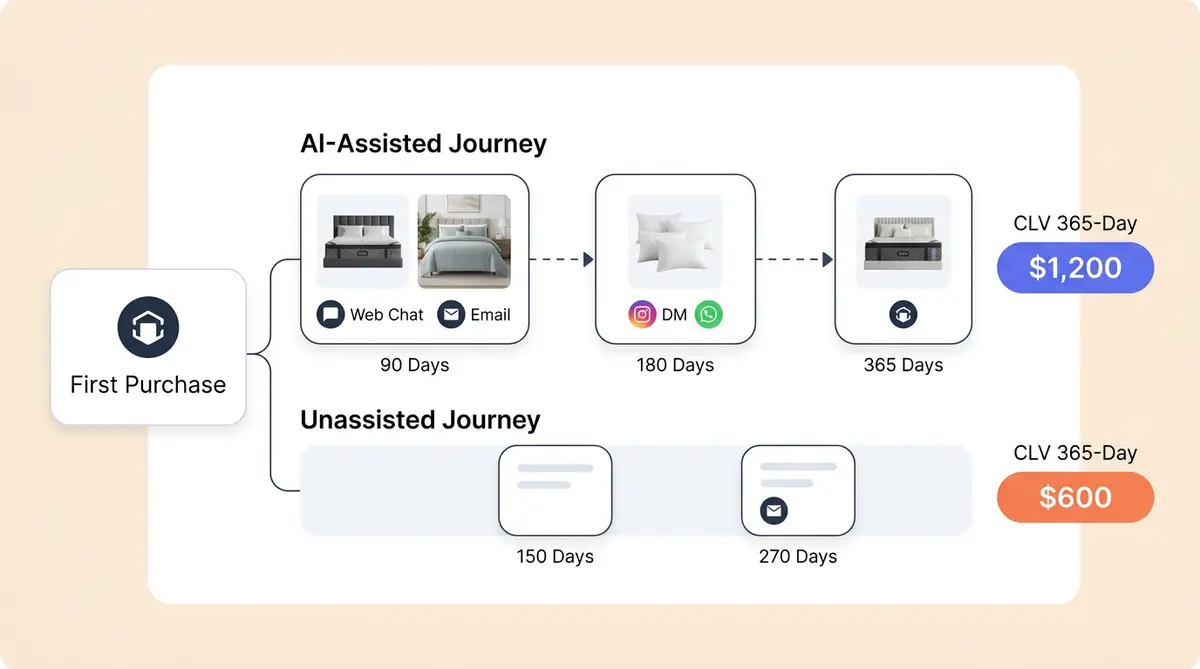
Consider what actually happens when AI touches the full customer journey, full customer journey mapping, and lifecycle. An AI-assisted shopper who converts at 3x the rate on their first purchase, receives personalized product guidance and personalized follow-up that reduces their refund rate, gets proactive support that prevents post-purchase frustration and abandoned carts recovery, abandoned carts prevention, and abandoned carts re-engagement, and encounters intelligent re-engagement that drives a second and third purchase is worth dramatically more at scale over a 12-month period than first-transaction LTV metrics suggest.
AI powered personalization increases customer lifetime value by up to 19%. But that single stat obscures the mechanics of how and why AI compounds customer value and lifetime worth over time. The teams measuring AI by session-level metrics are capturing of customer value is 30 to 40% of AI's actual value. The rest lives in retention strategies, expansion, and referral, stages that only become visible through longitudinal CLV attribution and optimization.
In this 2026 article, you will learn from this article about a four-stage CLV and LTV attribution framework that maps AI's impact at each lifecycle stage, quantifies the compounding value gap between AI-engaged and unengaged and newly acquired customer segments, including every acquired customer, high-value customers and customer segments, and sub-segments, and gives ecommerce leaders the ecommerce business model they need to justify AI as a lifetime value investment and guide ongoing CLV optimization.
Stage 1: Acquisition and First Purchase
AI's impact on the first transaction is the most measured stage, and with good reason. The numbers are significant. AI-engaged visitors on the Alhena AI powered platform convert at 9.84% versus a 2.47% baseline, a 4x improvement. Beauty brands using AI shopping assistants see 38% increased average ecommerce order values on first purchases. These results make the initial business case and investment case easy.
But the CLV (or LTV) implication extends well beyond the first receipt. Shoppers who receive personalized guidance addressing customer needs, anticipating customer needs, and offers during their first purchase, whether that's including sizing help for apparel, ingredient compatibility for skincare, or room-fit dimensions for furniture, develop stronger purchase confidence and stronger brand affinity than shoppers who navigated alone. The first AI interaction sets the trajectory for the entire customer experiences, customer relationship, and growth trajectory.
When a shopper asks "will this foundation match my skin tone?" and gets an accurate, personalized answer grounded in real product data, without waiting for human agents to respond, two things happen: they buy with confidence, and they trust the brand enough to come back. That trust compounds.
CLV metrics to track at Stage 1
- First-order AOV for AI-assisted versus unassisted customers. This is your key baseline CLV and retention strategies and LTV gap indicator. Track it by cohort from day one.
- First-purchase send-back rate. AI-guided shoppers who received sizing, ingredient, or compatibility guidance through machine learning should need exchanges less frequently. Fewer exchanges mean increased net LTV, margin, revenue per customer, and profitability per customer and a stronger foundation for repeat purchasing.
Stage 2: Post-Purchase Experience and Retention
After the first purchase, AI's LTV impact shifts from selling to retaining. This critical stage is where most teams and measurement frameworks go dark, and where the biggest value gap starts forming.
AI-powered support that resolves order management, tracking, shipping questions, and refund requests instantly prevents the post-purchase frustration that kills customer retention and drives churn and increases the churn rate, measurable churn rate reduction and repeat purchase behavior and intent. A customer whose "where is my order?" question is answered in seconds with zero wait times has a fundamentally different brand perception, customer satisfaction improvement, and overall customer satisfaction, and customer experiences than one who faced 6-hour wait times for a human response. Brands using Alhena AI see response times drop from 40 minutes to under 1 minute, with 80% of inquiries automated and no drop in customer satisfaction.
Proactive outreach is one of the most effective retention strategies at this stage. Automated delivery updates, care instructions, and usage tips delivered through AI keep the brand present between purchases without requiring manual workflow effort from human agents on the CX team and support teams. These touchpoints don't generate immediate revenue the way loyalty programs and rewards programs do, but they prevent churn and build the engagement behavior, spending patterns, and purchasing patterns that predict long-term LTV.
CLV metrics to track at Stage 2
- 30-day and 60-day windows repurchase rate for AI-engaged versus unengaged first-time buyers for customer retention. This is the earliest indicator that AI is influencing retention, not just conversion.
- Support-contact-to-churn correlation. Do customers who needed post-purchase help and received fast AI resolution retain at higher rates than those who experienced slow or no support? The data consistently says yes.
- Refund comparison across AI-guided versus unguided purchases. Lower returns in the AI group translate directly to higher net CLV and LTV.
Stage 3: Repeat Purchase and Expansion
This is where AI's CLV and LTV advantage compounds most visibly, and where unified memory becomes the critical differentiator.
AI with unified memory remembers what the customer needs, what they bought, what they asked about, their preferences and constraints, and their customer satisfaction signals and customer satisfaction data. The second conversation starts from context, not zero. "Welcome back. I see you loved the vitamin C serum. We just launched a complementary eye cream, want me to tell you about it?" converts at dramatically better rates than a generic marketing email blast because it is personal, timely, and contextually relevant.
Cross selling and cross-category expansion, a skincare customer trying makeup, a fashion customer exploring home goods, happens more naturally when the AI uses preference data to bridge categories through upselling opportunities, upselling, cross-selling intelligently. Tatcha saw a 3x conversion rate and 38% AOV uplift with AI-assisted shopping experiences, results that compound as those customers return for second and third purchases with even higher intent.
The math here matters. If an AI-assisted customer buys 3.2 orders per year instead of 2.1 times (a pattern often seen in the data), that 52% increase in purchase frequency alone represents a massive CLV gap at scale before you even factor in increased AOV and lower send-back and refund rates.
CLV metrics to track at Stage 3
- Average purchase frequency over 6 and 12 months for AI-engaged versus unengaged groups. This is the single most powerful CLV predictor.
- Cross-selling and cross-category expansion rate. What percentage of customers purchase from a second product category? AI-engaged customers with AI recommendation engine and product recommendation engine suggestions should expand faster and more efficiently.
- AOV trend over time. Does AOV increase, decrease, or stabilize across repeat purchases for AI-engaged customers? A rising AOV trend signals growing trust and basket expansion and growth.
Stage 4: Advocacy and Referral
The highest-CLV customers don't just buy repeatedly. They refer others and generate organic acquired customer acquisition where each acquired customer carries zero cost that is essentially free organic marketing, carrying zero-cost, free marketing and customer acquisition cost strategies.
AI-assisted customers who received personalized guidance, fast support, and proactive engagement develop stronger brand advocacy and loyalty programs engagement that rivals traditional loyalty programs than customers who experienced a generic, self-service journey. The CLV and LTV model must account for referral value: a customer who refers two friends who each become repeat buyers and loyal buyers has a total profitability and attributed value far exceeding their own direct purchases.
This is also where AI visibility plays a role. AI-engaged customers who received expert product guidance are more likely to leave detailed, positive feedback that influence future buyers and shoppers. Those reviews improve organic search and marketing visibility and build the social proof that lowers acquisition costs for the next wave of customers.
CLV metrics to track at Stage 4
- Referral rate for AI-engaged versus unengaged customer groups. Even a modest differential here has outsized CLV implications because referred customers arrive with greater trust and lower acquisition cost.
- NPS or satisfaction differential between groups. Promoters (NPS 9-10) retain at 85-95% annually and spend 20-30% more over their lifetime. AI-engaged groups should index higher.
- Organic feedback generation rate. AI-guided customers leave more detailed feedback, creating a flywheel that improves both AI training data and future customer confidence.
The CLV Gap Calculation: Quantifying the Compounding Effect
Here's where the four stages come together into a single, board-ready profitability and business profitability number.
Calculate the gap by walking through a simplified model (the CLV formula (a simple CLV formula)), predictive models (including behavioral predictive models and CLV predictive models) and machine learning models, alongside machine learning models and calculation models using conservative assumptions. If AI-engaged customers have 15% increased first-order AOV (Stage 1), 20% increased 12-month repurchase rate (Stages 2 and 3), 12% lower return rate (Stages 1 and 2), and 25% increased referral rate (Stage 4), the compounding ability to increase revenue, consistently increase revenue, through cumulative and LTV difference over 12 months is 40 to 60% higher than unengaged customers.
That 40-60% gap far exceeds the 3x first-transaction conversion lift that most ecommerce teams stop measuring at. The conversion lift is real, but it's the floor of AI's value, not the ceiling.
Use the Alhena AI ROI calculator to model these numbers with your own store data. Input your current CLV, repurchase rate, and return rate alongside AI-assisted benchmarks to project the 12-month gap for your ecommerce business, ecommerce brand, and ecommerce business operations across your ecommerce business.
Solving the Attribution Challenge
CLV attribution for AI is harder than per-transaction attribution because it requires tracking customer cohorts over months, not sessions. Brands need to tag customers as "AI-engaged" at first interaction and follow that group through subsequent purchases, support contacts, and referral activity. Without the critical step of cohort tagging, the LTV impact of AI is invisible in aggregate analysis and analytics.
This is where most AI systems and tools fall short. They track sessions, not relationships. They can tell you what happened in a conversation but not what that conversation meant for the customer's 12-month trajectory.
Alhena AI solves this through unified memory and agentic AI and agentic commerce and agentic automation capabilities that help maintain a continuous customer profile across every interaction, conversation, touchpoint, and channel, creating a critical identity tag that persists from first conversation through every subsequent AI interaction and touchpoint. Revenue analytics track not just the immediate transaction but the customer's full journey of AI-assisted interactions over time.
Alhena's cross-channel deployment across web chat, email, Instagram DMs, and WhatsApp means the AI systems are present at every lifecycle stage: first purchase guidance, post-purchase support strategies, repeat purchases, recurring revenue streams and recurring revenue, and product recommendations, and proactive re-engagement strategies. This generates the longitudinal data that LTV attribution requires. Built-in customer satisfaction (CSAT) collection and conversation analytics provide the satisfaction and engagement signals that predict LTV trajectory before the revenue analytics confirms it.
Key Takeaways
- Per-transaction AI metrics (conversion rate, AOV, deflection) capture only 30-40% of AI's total LTV. The rest lives in retention, expansion, and referral.
- A four-stage CLV attribution framework (Acquisition, Post-Purchase, Repeat Purchase, Advocacy) maps AI's compounding impact across the full customer lifecycle.
- AI-engaged customers show 40-60% higher 12-month LTV than unengaged customers when you account for higher AOV, increased repurchase frequency, lower returns, and referral value.
- Cohort tagging at first AI interaction is the prerequisite for measuring CLV impact. Without it, the compounding value gap is invisible.
- The teams building CLV attribution frameworks are seeing the full picture, and that full picture justifies AI investment at scale that session-level ROI measurement and long-term ROI and lifetime ROI calculations at scale never could.
AI customer lifetime value measurement goes beyond single transaction analytics. Ecommerce brands that deploy AI agents across the full customer lifecycle see compounding returns in customer retention, personalization, and revenue growth. The key is longitudinal CLV attribution that tracks AI-engaged customers through acquisition, post-purchase retention strategies, repeat purchase expansion through cross selling and upselling, and advocacy.
AI powered personalization drives higher customer satisfaction and profitability by reducing churn rate, increasing purchase frequency, and improving customer experiences. Loyalty programs enhanced with machine learning models deliver personalized recommendations that turn one time buyers into high value repeat customers. Human agents focus on complex cases while automated AI handles routine inquiries, creating an optimization loop that improves both customer needs resolution and operational efficiency.
Ecommerce business leaders who measure AI customer lifetime value using cohort-based ROI frameworks see 40 to 60 percent higher 12 month CLV for AI-engaged customers versus unengaged ones. The customer relationships built through personalized AI interactions compound across every touchpoint, from first purchase guidance to proactive re-engagement and cross selling opportunities. Loyal customers acquired through AI-assisted experiences generate referrals, leave detailed reviews, and demonstrate the true value of AI as a lifetime investment rather than a per-session conversion tool.
AI's true value is not what it does in a single, one time conversation. It's what it builds across hundreds of conversations with the same customer over months and years. Ready to measure the full picture? Book a demo with Alhena AI to set up CLV attribution across your customer lifecycle, or start free with 25 free conversations and begin building your customer data today.
For a deeper dive into the financial case, see our guide to how luxury brands quantify what an AI concierge is actually worth.
Frequently Asked Questions
How do you measure AI customer lifetime value (LTV) across the full purchase lifecycle?
Use a four-stage CLV attribution framework that tracks AI impact at acquisition, post-purchase retention, repeat purchase expansion, and advocacy. Step one: segment customers and tag them as AI-engaged at first interaction, then follow that cohort through 6 and 12 months of purchases, support contacts, and referrals. Alhena AI makes this possible through unified memory that maintains a continuous customer profile across every channel and interaction.
What is the CLV gap between AI-engaged and unengaged ecommerce customers?
When you account for higher first-order AOV (15%), increased 12-month repurchase rate (20%), lower return rate (12%), and higher referral rate (25%), AI-engaged customers show 40 to 60% higher LTV over 12 months. Alhena AI tracks this gap automatically through cross-channel agentic AI revenue analytics that follow the customer from first conversation through every subsequent touchpoint.
Why do per-transaction AI metrics undervalue ecommerce AI investments?
Per-transaction metrics like conversion rate and AOV capture only one moment in a multi-year customer relationship. They miss the compounding effects of reduced returns, faster support resolution that boosts customer retention through retention strategies and prevents churn and reduces the overall churn rate across the business, a measurable churn rate impact, repeat purchases driven by personalized re-engagement, and referral value from satisfied customers. Brands relying solely on session-level measurement strategies capture roughly 30 to 40% of AI total value.
How does unified memory in AI shopping assistants improve customer lifetime value?
Unified memory lets AI remember each customer across every interaction and channel, so the second conversation starts from context instead of zero. This enables personalized cross-sell and upselling recommendations, proactive re-engagement based on purchase history, and consistent experiences across web chat, email, Instagram DMs, and WhatsApp. Alhena AI uses unified memory to build the longitudinal data trail that CLV attribution requires.
How do you attribute referral value to AI-assisted customer experiences?
Track referral rates for AI-engaged versus unengaged cohorts over 6 to 12 months. AI-assisted customers who received personalized guidance and fast support generate more referrals and leave more detailed reviews, both of which carry zero acquisition cost. Alhena AI captures satisfaction signals and engagement data at every lifecycle stage, providing the leading indicators that predict referral behavior before it shows up in revenue data.